간트 차트로 프로젝트 목표를 시각화하세요
팀은 간트 차트를 사용해 복잡한 프로젝트를 시각적으로 관리 가능한 단계로 나누고 주요 목표에 집중할 수 있습니다.
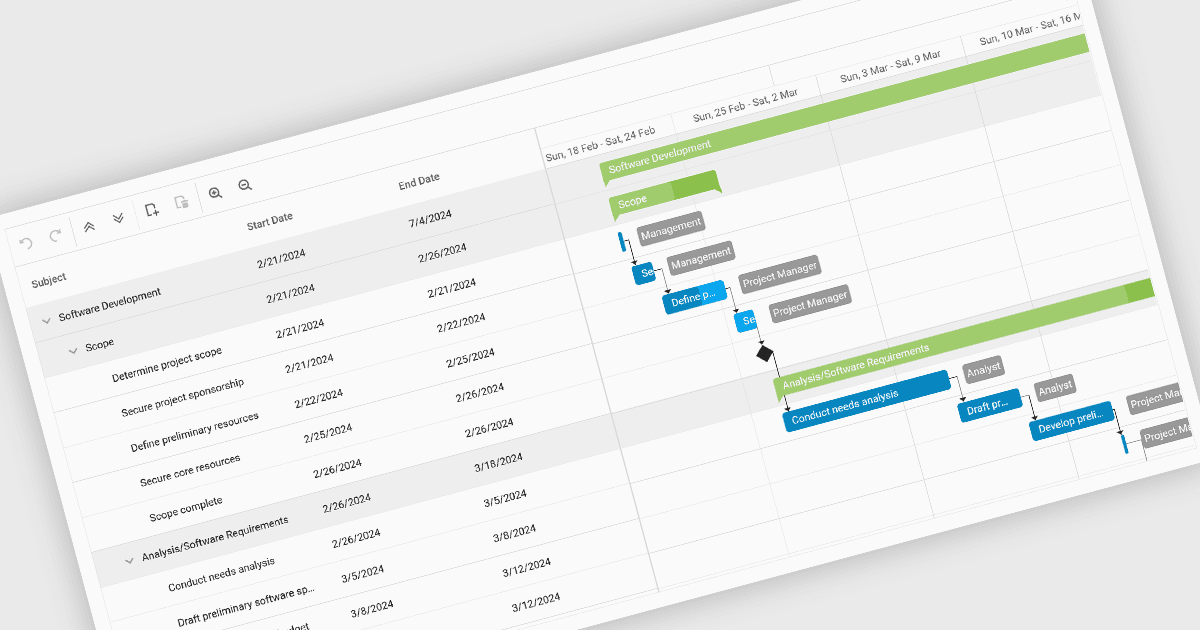
간트 차트는 막대형 차트의 특수한 유형으로, 프로젝트 관리에서 특히 작업, 종속성, 진행 상황의 타임라인을 시각화하고 추적하는 데 매우 유용한 도구입니다. 이 차트는 프로젝트 일정, 자원 할당, 핵심 경로를 설명하는 데 이상적입니다. 프로젝트 마일스톤에 대한 명확하고 간결한 개요를 제공함으로써 간트 차트는 효과적인 기획, 커뮤니케이션, 모니터링을 가능하게 하며, 궁극적으로 조직이 프로젝트 목표를 효율적으로 그리고 제때 달성할 수 있도록 돕습니다.
다음과 같은 여러 React 차트 컨트롤에서 간트 차트를 제공합니다:
- DevExtreme Chart (DevExpress의 DevExtreme Complete 일부)에서는 종속성, 진행 상황 추적, 대화형 타임라인으로 간트 차트를 쉽게 관리할 수 있습니다.
- Highcharts Gantt (Highsoft 제공)은 드래그 앤 드롭 기능, 작업 종속성, 복잡한 타임라인 전반에 걸친 실시간 업데이트로 동적인 프로젝트 관리를 지원합니다.
- KendoReact Chart (Telerik의 KendoReact 일부)에서는 작업 계획, 진행 상황 추적, React와의 원활한 통합을 통해 대화형 간트 차트를 만들 수 있습니다.
- Wijmo FlexChart and FinancialChart (MESCIUS의 Wijmo 일부)에서는 사용자 지정 가능한 시간 스케일, 종속성, 마일스톤, 풍부한 시각화 기능을 갖춘 간트 차트를 지원합니다.
기능과 가격에 대한 심층 분석은 React 차트 컨트롤 비교를 방문하세요.