


공식 공급 업체
200 이상의 소프트웨어 개발처와 판매 계약을 맺은 공인 디스트리뷰터로서 합법적인 라이선스를 제공합니다.
모든 브랜드 보기.
영어로 계속 읽기:
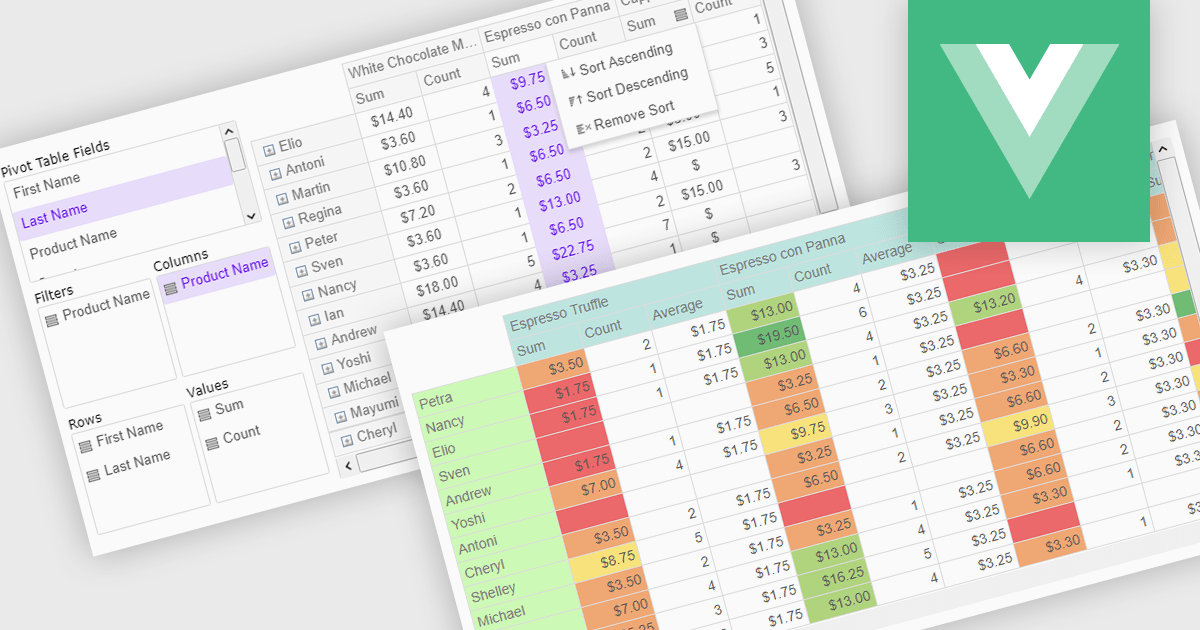
Pivot grids or tables are dynamic tools that allow users to organize and analyze large datasets interactively by allowing them to group, filter, and summarize data across multiple dimensions. This functionality makes it easier to spot patterns and insights, supporting faster decision-making and data processing. Common use cases include help to identify trends in product performance or customer demographics, or financial applications, where users can analyze and forecast expense patterns. Pivot grids empower users with an adaptable and user-friendly interface, offering both high-level overviews and detailed insights with minimal effort.
Several Vue.js UI suites offer pivot grid components including:
For an in-depth analysis of features and price, visit our comparison of Vue.js UI suites.
전화 : 00798 14 800 6332
팩스 : +1 770 250 6199


