


공식 공급 업체
200 이상의 소프트웨어 개발처와 판매 계약을 맺은 공인 디스트리뷰터로서 합법적인 라이선스를 제공합니다.
모든 브랜드 보기.
영어로 계속 읽기:
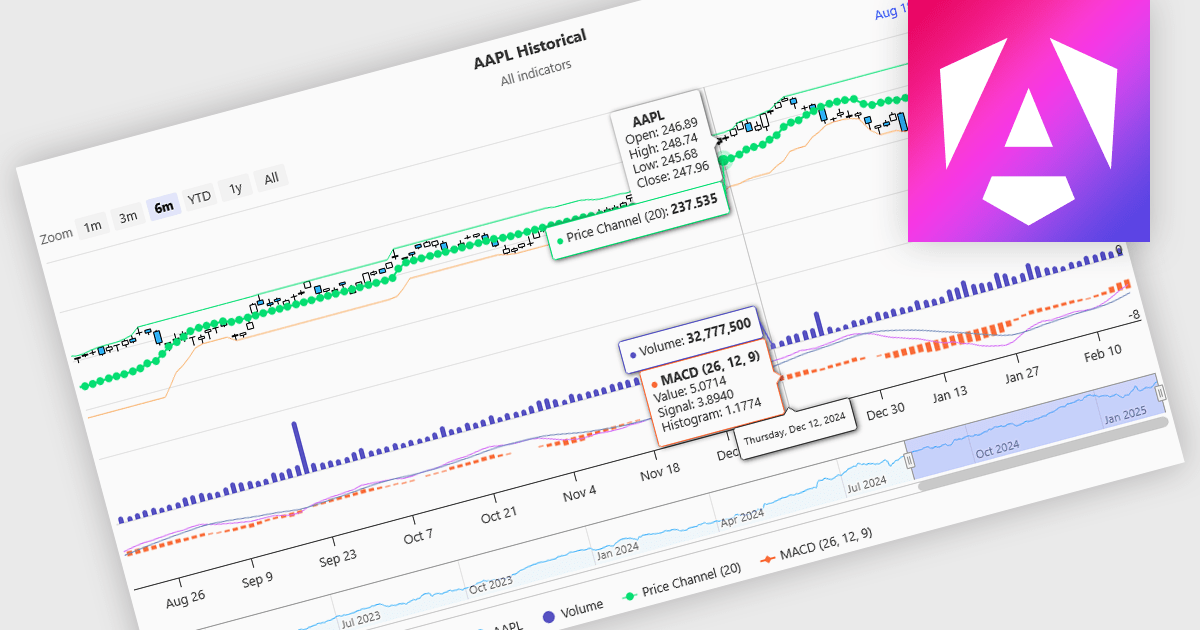
Indicators in a financial chart are mathematical formulas applied to market data, such as price and volume, to generate insights into trends, momentum, volatility, and trade opportunities. Indicators are visualized as lines, histograms, or overlays on the chart, providing dynamic analysis rather than static points. Moving averages track price trends with smooth lines, while oscillators like RSI appear as separate graphs to measure momentum. These tools help traders analyze patterns, confirm price movements, and support decision-making. For software developers, integrating indicators enhances data visualization, enables algorithmic trading strategies, and improves user experience by delivering clear, actionable insights.
Several Angular charting components provide support for indicators within financial charts, including:
For an in-depth analysis of features and price, visit our Angular chart components comparison.
전화 : 00798 14 800 6332
팩스 : +1 770 250 6199


