시간에 따른 추세를 꺾은선형 차트로 시각화
꺾은선형 차트는 지표의 진행 흐름을 한눈에 보여 주며, 다중 시리즈 비교, 변화(이동) 지점 식별, 전략적 예측을 가능하게 합니다.
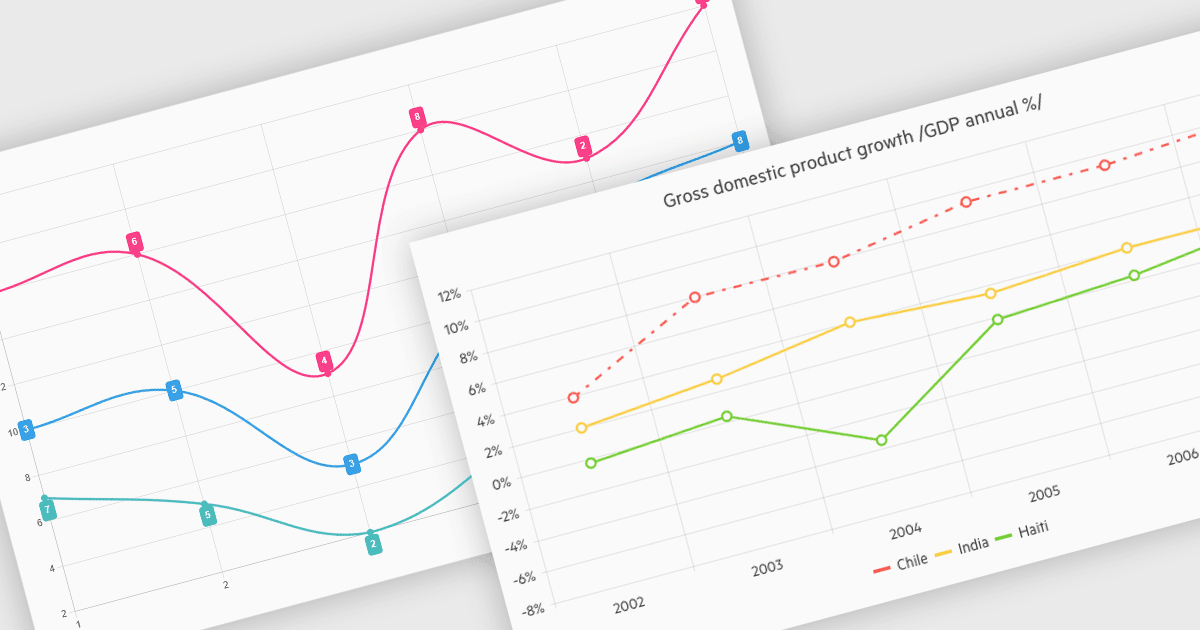
꺾은선형 차트는 연속적인 스케일(보통 시간)에 따라 값이 어떻게 변하는지 보여주기 위해 데이터 포인트를 선으로 연결합니다. 동일한 축에서 여러 시리즈를 비교하는 동안 장기 추세, 계절 패턴, 갑작스러운 변화를 쉽게 파악할 수 있습니다. 진행 상황과 이상 징후를 복잡하게 만들지 않고 강조함으로써 꺾은선형 차트는 원시 숫자를 명확하고 실행 가능한 인사이트로 바꾸는 데 도움이 됩니다.
여러 .NET Blazor Chart Controls에서는 꺾은선형 차트를 지원합니다. 예:
- Blazorise Chart를 사용하면 부드러운 애니메이션, 툴팁, 줌, 반응형 레이아웃을 통해 고성능 실시간 앱에 적합한 사용자 지정 가능한 꺾은선형 차트를 만들 수 있습니다.
- TeeChart Blazor는 Steema Software에서 제공하며 여러 시리즈, 스타일링, 대화형 팬 및 줌 제어, 내보내기 기능을 갖춘 고성능 꺾은선형 차트를 렌더링할 수 있습니다.
- Infragistics Blazor Charts (Infragistics Ignite UI의 일부)는 스타일링, 축 사용자 지정, 실시간 업데이트, 데이터 마커 및 툴팁을 통해 반응형 꺾은선형 차트 생성을 지원합니다.
- DevExpress Blazor Chart (DevExpress ASP.NET 및 Blazor의 일부)는 개발자가 줌과 사용자 지정 가능한 범례를 포함하는 대화형 꺾은선형 차트를 만들 수 있도록 합니다.
기능과 가격에 대한 자세한 분석은 .NET Blazor Chart Controls 비교 페이지를 방문하세요.