보고서에 위치 인사이트를 추가하세요
지도는 매력적인 시각 자료로 시각적 명확성을 높여 지리적 패턴을 드러내고 더 정보에 근거한 의사결정을 지원합니다.
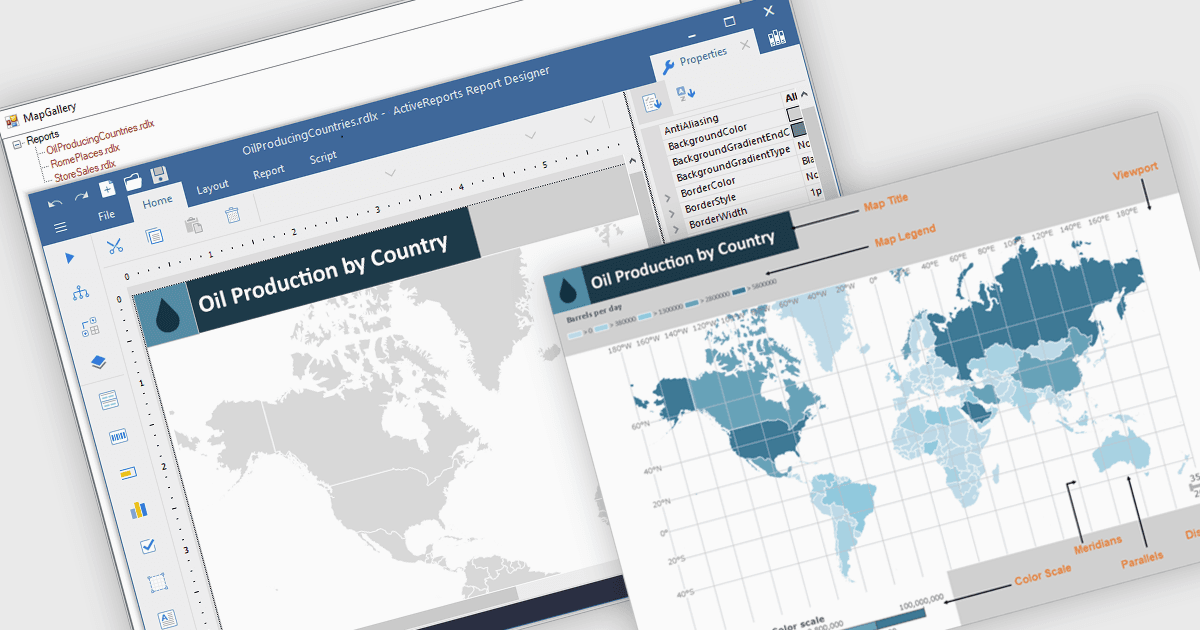
보고서의 지도는 지리 데이터를 표시하는 시각적 도구로, 사용자가 특정 지역 전반에 걸쳐 활동, 추세 또는 값이 나타나는 위치를 확인할 수 있게 해줍니다. 복잡한 위치 기반 정보를 명확하고 직관적인 시각 자료로 변환함으로써 지도는 이해를 돕고, 공간적 패턴을 강조하며, 표나 차트에서는 놓칠 수 있는 인사이트를 드러냅니다. 이 추가적인 지리적 맥락은 보다 정보에 근거한 의사결정을 지원하고, 더욱 설득력 있는 데이터 스토리텔링을 가능하게 합니다. 일반적인 활용 사례로는 지역별 매출 성과 추적, 고객 분포 지도화, 서비스 제공 범위 분석, 시장 확장 기회 제시 등이 있습니다. 정적이든 인터랙티브든, 지도는 기술 사용자와 비기술 사용자 모두에게 보고서를 더 흥미롭고 효과적으로 만듭니다.
여러 .NET 보고(Reporting) 컨트롤에서 지도를 제공합니다. 예를 들면:
- Stimulsoft Reports.Web 는 동적 드릴다운 및 지역별 상세 정보를 통해 지리 데이터를 시각화하는 인터랙티브 지도를 보고서에 통합할 수 있게 해줍니다.
- FastReport .NET 은 보고서에 상세한 지도를 포함하여 사용자가 공간 데이터를 분석하고 한눈에 지역 추세를 파악할 수 있도록 돕습니다.
- Telerik Reporting 은 동적인 지도 통합을 제공하여 지리공간 인사이트를 시각적으로 제시하고, 서로 다른 지리적 영역에 걸친 데이터의 맥락과 명확성을 높입니다.
- ActiveReports.NET 은 보고서 내에서 레이어드 지도 시각화를 활용하여 위치 기반 데이터를 표시하고 의미 있는 지리적 패턴을 효율적으로 드러내는 데 유용합니다.
기능과 가격에 대한 자세한 분석은 .NET 보고(Reporting) 컨트롤 비교를 참고하세요.