고품질 SVG로 대시보드를 내보내기
DevExpress BI Dashboard v25.1은 이제 인쇄, 공유 또는 문서 임베딩을 위한 확장 가능한 벡터 이미지를 내보낼 수 있습니다.
DevExpress BI Dashboard (DevExpress Universal의 일부) 는 데스크톱, 웹 및 모바일 애플리케이션용으로 대화형 대시보드를 손쉽게 만들 수 있도록 지원합니다. 코드를 작성하지 않고도 대시보드를 구축할 수 있는 시각적 디자이너를 제공하며, 다양한 데이터 시각화 위젯을 캔버스에 드래그 앤 드롭할 수 있습니다. 이러한 위젯은 데이터 소스에 연결되고 동적으로 업데이트되어, 최종 사용자에게 실시간 인사이트를 제공합니다. 또한 속성과 이벤트를 통한 사용자 지정도 지원하므로, 애플리케이션 디자인에 완벽하게 통합되도록 대시보드의 모양과 느낌을 원하는 대로 조정할 수 있습니다.
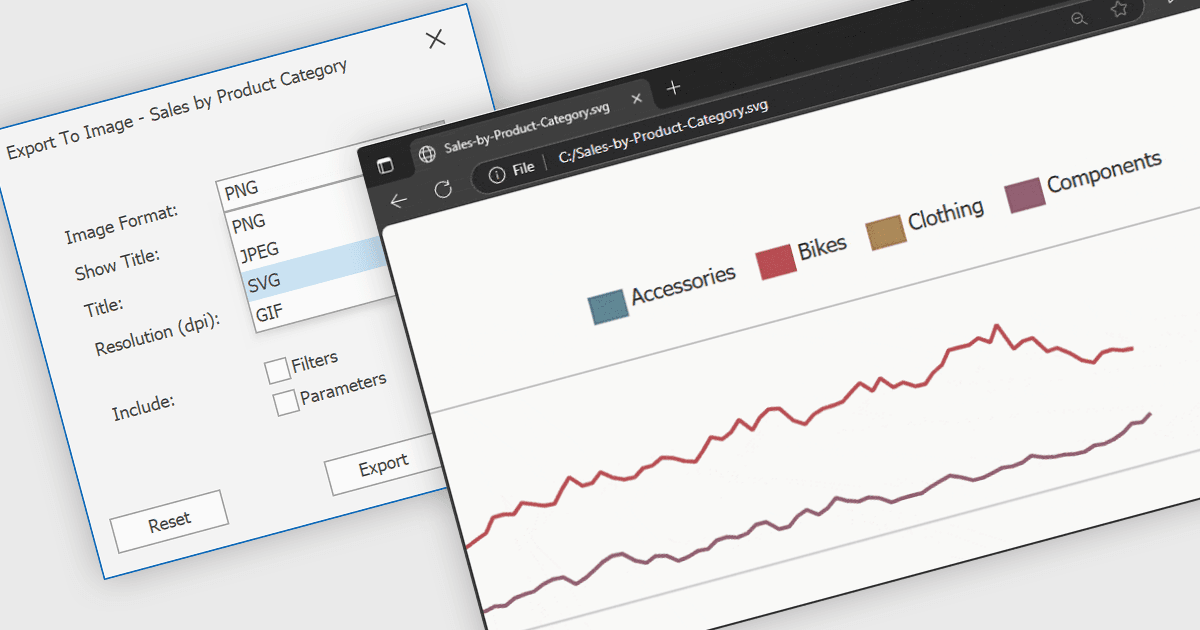
DevExpress BI Dashboard v25.1 업데이트에서는 전체 대시보드, 특정 항목 또는 탭 페이지를 Scalable Vector Graphics (SVG) 형식으로 내보낼 수 있는 기능이 추가되었습니다. 이번 향상으로 사용자는 해상도에 구애받지 않으며, 어떤 크기에서도 선명도를 유지하는 고품질 내보내기를 만들 수 있습니다. SVG 출력은 인쇄용 리포트, 공유 프레젠테이션 또는 문서에 통합하는 경우처럼 시각적 완성도가 중요한 작업에 특히 유용합니다.
버전 25.1에서 새롭게 추가된 전체 항목 목록은 릴리스 노트를 참고하세요.
DevExpress BI Dashboard는 개발자 단위로 라이선스되는 DevExpress Universal의 일부로 포함되며, 12개월 지원 및 유지보수 구독이 포함된 Perpetual License(영구 라이선스)로 제공됩니다. 자세한 내용은 DevExpress Universal 라이선싱 페이지를 참조하세요.
DevExpress BI Dashboard는 다음 제품에서 사용할 수 있습니다: