시각적 정밀함으로 시장 추세를 보여주세요
카기 차트를 포함한 JavaScript 차트 컨트롤은 노이즈를 줄이고, 브레이크아웃을 강조하며, 시장 역학에서 공급과 수요의 추세를 드러냅니다.
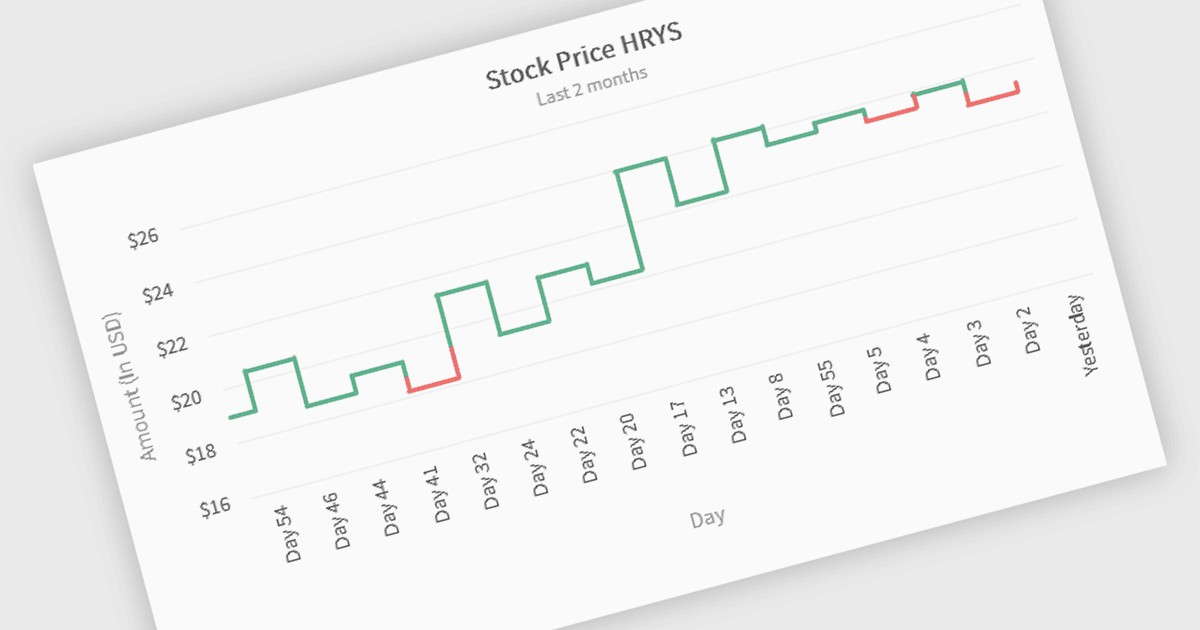
카기(Kagi) 차트는 중요한 가격 변동에 집중하기 위해 시간을 무시하고 세로선으로 가격 움직임을 표시하는 기술적 분석 도구입니다. 굵은 선은 가격이 이전 고점을 돌파할 때 상승 수요를 나타내며, 얇은 선은 가격이 이전 저점 아래로 하락할 때 증가한 공급을 신호합니다. 이러한 명확한 시각적 형식은 트레이더가 노이즈를 걸러내고, 추세를 파악하며, 핵심 브레이크아웃(돌파) 또는 반전을 식별하는 데 도움이 됩니다. 시장 심리 분석에 이상적인 카기 차트는 주식, 외환(forex), 상품(commodities) 전반에서 사용되어 자신감 있는 데이터 기반 트레이딩 결정을 지원합니다.
여러 JavaScript 차트 구성 요소가 카기 차트를 제공하며, 예는 다음과 같습니다:
- Wijmo FlexChart (MESCIUS의 Wijmo 제품군의 일부)는 카기 차트를 사용해 가격 동역학을 해석할 수 있도록 하여, 노이즈를 필터링하고 더 명확한 트레이딩 신호와 심리를 드러내도록 돕습니다.
- FusionCharts Suite XT는 카기 차트 렌더링을 지원하여 가격 브레이크아웃과 반전을 강조함으로써, 추세 기반 시장 시각화의 선명도를 높여줍니다.
- LightningChart JS Trader는 고성능 실시간 금융 데이터 분석을 위해 카기 차트로 공급과 수요의 변화를 시각화할 수 있게 해줍니다.
기능과 가격에 대한 심층 분석은 JavaScript 차트 비교를 방문하세요.