즉각적인 평가를 위한 핵심 메트릭 표시
.NET 앱에서 효율적인 데이터 시각화를 위해 게이지 컨트롤을 사용하여 실시간 숫자 데이터를 표시하는 대시보드 및 모니터링 도구를 만드세요.
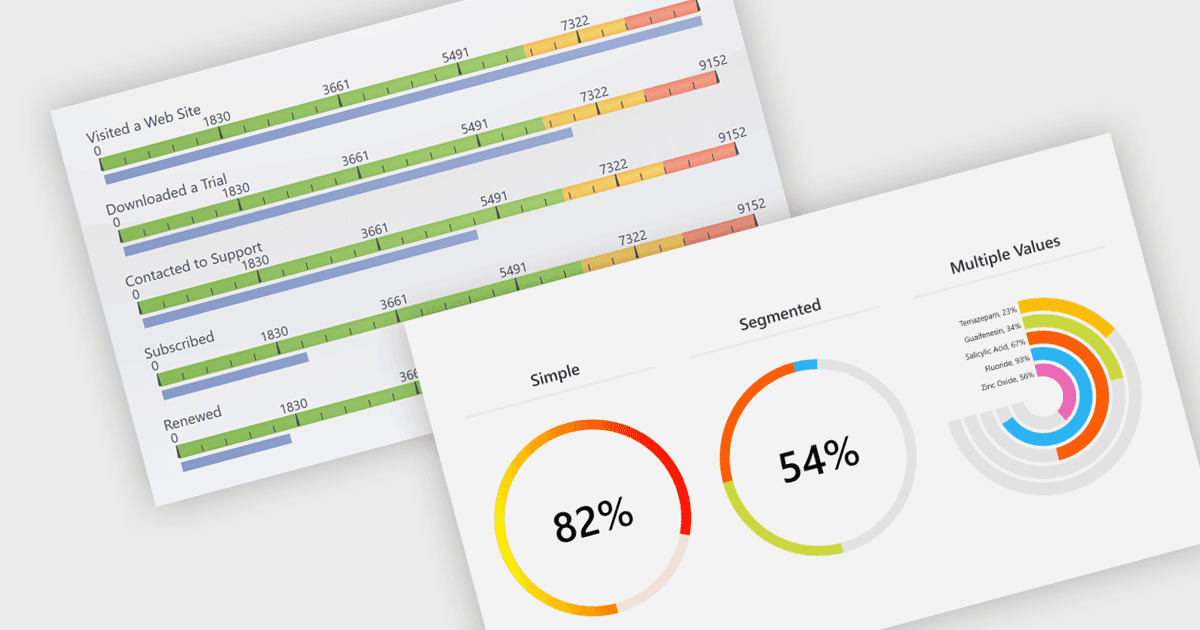
게이지는 미리 정의된 범위 내의 숫자 값을 시각적으로 표시하는 데 사용되는 특수 차트 구성 요소로, 방사형, 선형 또는 디지털 미터와 같은 형태로 제공되는 경우가 많습니다. 게이지는 대시보드와 모니터링 도구에서 흔히 사용되며, 주요 기능은 성능 지표나 시스템 메트릭에 대해 즉각적인 시각적 피드백을 제공하는 것입니다. 게이지는 실시간 데이터를 명확하게 전달하는 데 특히 유용하여, 사용자가 메트릭의 현재 상태를 빠르게 확인하고 값이 허용 범위 내에 있는지 또는 주의가 필요한지를 판단할 수 있도록 합니다.
여러 .NET 차트 구성 요소에서도 게이지를 제공하며, 예를 들면:
- DevExpress WPF Chart (DevExpress WPF의 일부)는 다양한 대화형 게이지 컨트롤과 사전 설계된 레이아웃을 제공하여 WPF 애플리케이션에 임베드할 수 있습니다.
- ComponentOne Charts for WinForms (MESCIUS의 ComponentOne Studio WinForms)은 고급의 고도로 사용자 지정 가능한 게이지를 설계할 수 있도록 해줍니다.
- Telerik ASP.NET AJAX Chart (Telerik UI for ASP.NET AJAX의 일부)는 메트릭 값을 효과적으로 시각화하기 위한 사용자 지정 가능한 호(arc), 원형(circular), 방사형(radial), 선형(linear) 게이지 컨트롤을 제공합니다.
- Syncfusion Blazor Chart (Syncfusion Essential Studio UI Component Suite의 일부)에는 대시보드와 모니터링에 적합한 사용자 지정 가능한 원형 또는 선형 스케일을 포함한 게이지가 포함되어 있습니다.
기능과 가격에 대한 심층 분석은 .NET 차트 구성 요소 비교를 방문하세요.