.NET에서 OHLC 차트로 주식 데이터를 표시
OHLC(Open-High-Low-Close) 차트를 사용해 시간에 따른 가격 변동을 표시함으로써 고성능 데이터 시각화로 금융 앱을 강화하세요.
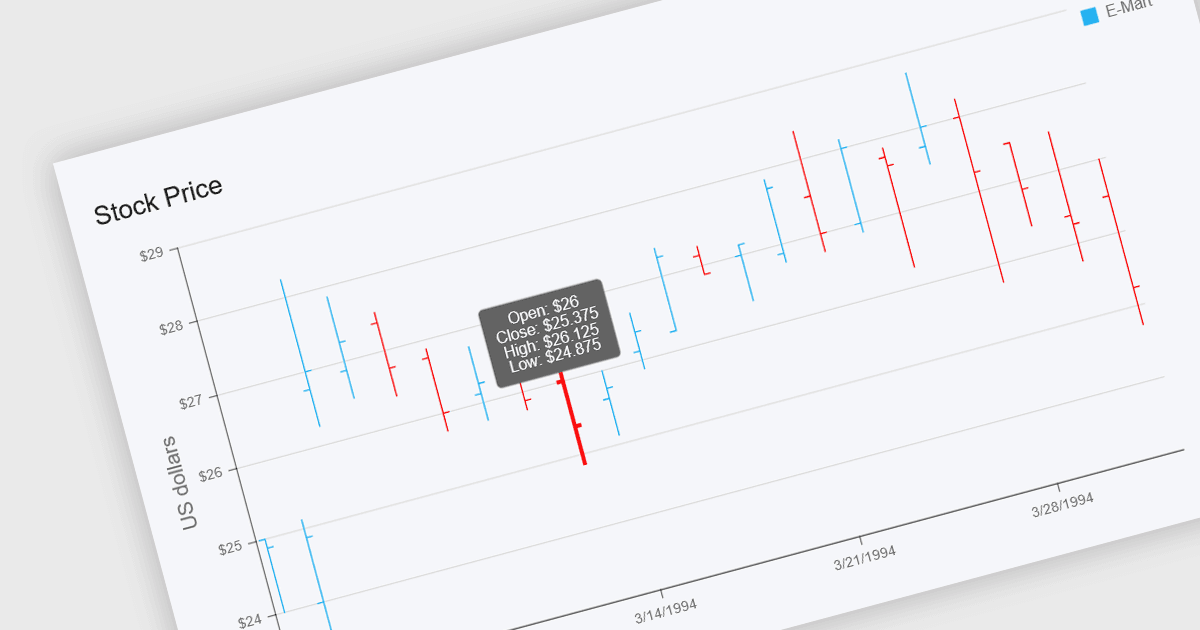
OHLC 차트(Open-High-Low-Close 차트의 약자)는 특정 기간 동안 자산의 가격 변동을 나타내기 위해 사용하는 일종의 금융 차트입니다. 차트의 각 지점은 해당 기간의 시가, 최고가, 최저가, 종가를 요약하며, 보통 세로 막대에 틱(tick)을 표시해 시가와 종가 값을 나타냅니다. 이 형식은 주어진 기간 내 변동성과 시장 동향을 명확하고 간결하게 시각화할 수 있게 해줍니다. 금융 데이터를 다루는 개발자와 분석가에게 OHLC 차트는 가격 패턴을 식별하고 시장의 움직임을 모니터링하며 과거 성과에 기반해 정보에 입각한 결정을 내리는 데 특히 유용합니다.
다음과 같은 여러 .NET 차트 구성 요소에서 OHLC 차트를 제공합니다:
- DevExpress ASP.NET Core Charts (DevExpress ASP.NET 및 Blazor의 일부)에서는 도구 설명(툴팁)과 반응형 디자인을 통해 실시간 금융 분석을 위한 OHLC 차트를 렌더링할 수 있습니다.
- ComponentOne WinForms Charts (MESCIUS의 ComponentOne Studio WinForms의 일부)에서는 데스크톱 앱에서 시장 동향을 정밀하게 시각화하기 위해 OHLC 데이터를 플로팅할 수 있습니다.
- Telerik UI for WPF ChartView (Telerik UI for WPF의 일부)에서는 유연한 축과 스타일 옵션을 통해 고성능 OHLC 차트 렌더링을 지원하여 데스크톱 금융 대시보드에 적합합니다.
- Syncfusion .NET MAUI Charts (Syncfusion Essential Studio Enterprise의 일부)에서는 대화형·애니메이션 OHLC 차트를 통해 개발자가 크로스플랫폼 모바일 앱을 만들 수 있도록 지원합니다.
기능과 가격에 대한 심층 분석은 .NET 차트 구성 요소 비교를 방문하세요.