Blazor 차트에서 추세를 강조하기 위해 지표를 추가하세요
계산된 추세와 임계값을 시각화 위에 직접 오버레이하여 데이터 해석을 향상하세요.
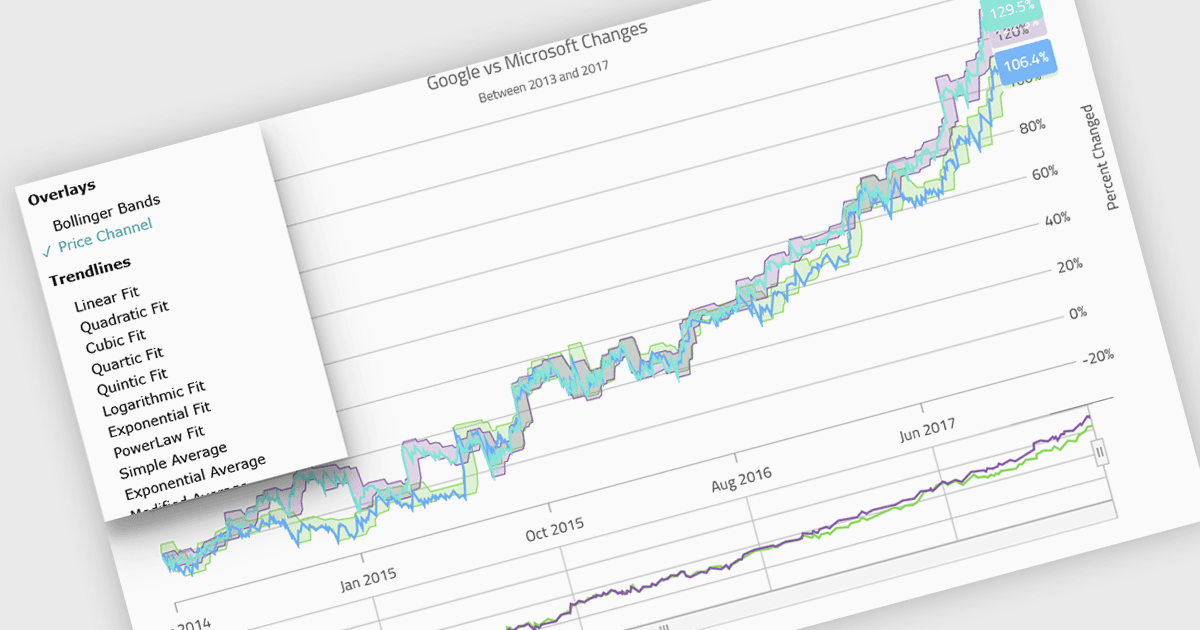
차트 컴포넌트의 지표(Indicators)는 차트 위에 특정 통계 또는 수학 계산 결과를 직접 표현하는 시각적 도구로, 기본 데이터 내에서 추세, 패턴 또는 주요 임계값을 강조하는 데 자주 사용됩니다. 금융 및 분석 애플리케이션에서 흔히 사용되며, 이동 평균, 볼린저 밴드, 임계값(Threshold) 라인과 같은 요소를 포함할 수 있습니다. 소프트웨어 개발자에게 지표를 구현하는 것은, 사용자가 차트 인터페이스를 벗어나지 않고도 의미 있는 맥락과 실행 가능한 인사이트를 확인할 수 있게 함으로써 데이터 해석을 향상하는 강력한 방법입니다. 이는 의사결정을 개선하고 다양한 사용 사례 전반에서 더 상호작용적이며 유익한 시각화를 지원합니다.
여러 .NET Blazor 차트 컨트롤이 지표를 지원합니다. 예:
- TeeChart .NET for Blazor Steema Software에서 제공하며, 50개가 넘는 금융 및 통계 지표를 대화형 Blazor 차트에 직접 포함할 수 있습니다.
- NOV Chart for .NET Nevron에서 제공하며, 2D/3D 차트에 금융, 추세 및 통계 지표 전반을 적용할 수 있어 대규모 데이터 렌더링을 지원합니다.
- Infragistics Ignite UI for Blazor Chart (Infragistics Ignite UI의 일부)에서는 개발자가 65개 이상의 차트 유형 위에 추세선 및 데이터 분석 오버레이를 중첩할 수 있습니다.
- Syncfusion Blazor Charts (Syncfusion Essential Studio Enterprise의 일부)에서는 추세선 및 기준 마커 같은 분석 오버레이를 통합하여 차트 데이터를 풍부하게 할 수 있습니다.
기능과 가격에 대한 심층 분석은 .NET Blazor 차트 컨트롤 비교를 확인하세요.