목표 지향 불릿 차트로 진행 상황을 확인하세요
콤팩트한 불릿 차트에서 예산, 예측, 실적 값을 비교해 변동을 즉시 파악하고 목표 대비 진행 상황을 명확하게 추적하세요.
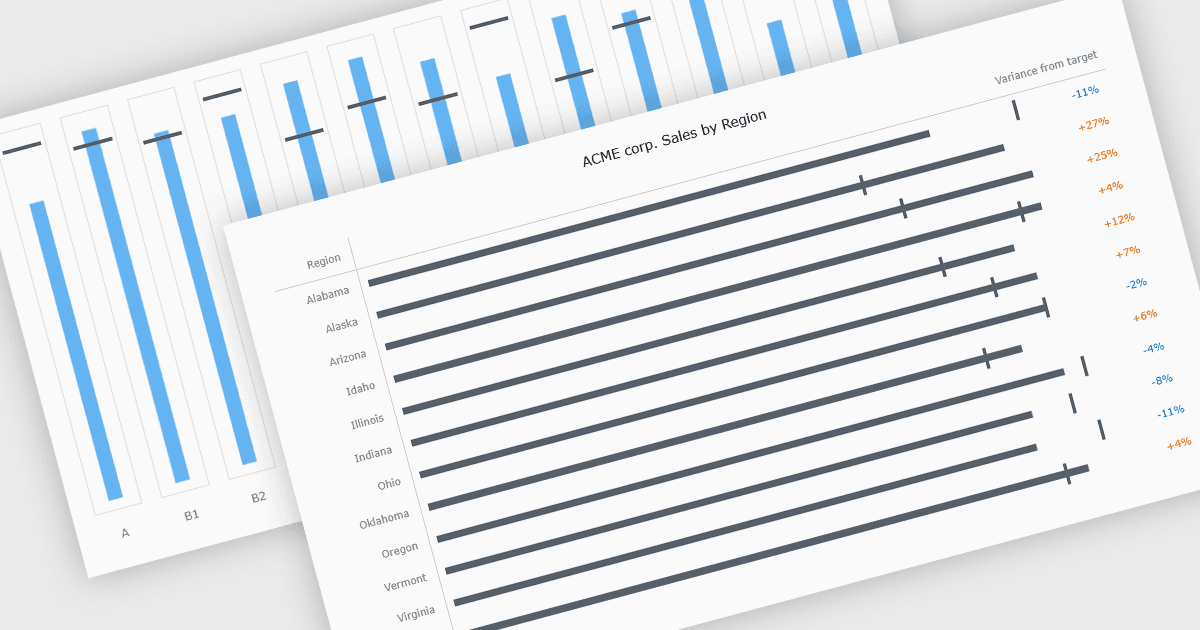
불릿 차트는 실제 성과를 예산 및 예측 값과 같은 목표와 벤치마크와 비교해, 단일하고 읽기 쉬운 화면에서 한눈에 보여주는 목표 지향적 시각화입니다. 진행 상황을 목표에 대한 도달 여부로 나타내면서 변동과 부족분을 즉시 드러내기 때문에, 게이지와 미터에 대한 명확한 대안을 제공합니다. 여러 참조 지점을 함께 제시함으로써 불릿 차트는 다양한 지표 전반에서 이해관계자가 성과를 빠르고 일관되게 해석하도록 돕습니다. 일반적인 사용 사례로는 재무 보고, 매출 및 마진 추적, KPI 대시보드, 운영 스코어카드, 그리고 빠르고 신뢰할 수 있는 비교가 더 나은 의사결정을 지원하는 경영진 요약 등이 있습니다.
몇 가지 JavaScript 차트 컨트롤에서는 불릿 차트 지원을 제공합니다. 여기에는:
- Highcharts Core by Highsoft를 사용하면 대화형 툴팁, 반응형 레이아웃, 사용자 지정을 통해 목표 대비 성과를 비교하는 불릿 차트를 만들 수 있습니다.
- KendoReact Charts (Telerik의 KendoReact 일부)는 KPI, 정성적 범위, 접근성 친화적인 구성요소를 강조하면서 불릿 차트를 렌더링할 수 있게 해줍니다.
- amCharts 5: Charts는 애니메이션 전환, 유연한 축, 정밀한 벤치마크, 데이터 기반 대시보드 애플리케이션용 테마를 통해 최신 불릿 차트를 손쉽게 구현할 수 있도록 합니다.
- Syncfusion JavaScript Charts (Syncfusion Essential Studio Enterprise의 일부)는 목표, 범위 및 실적을 보여주는 불릿 차트를 만들 수 있게 해줍니다.
기능과 가격에 대한 심층 분석을 보려면 JavaScript 불릿 차트 컨트롤 비교 페이지를 방문하세요.