인터랙티브 차트 줌으로 인사이트를 발견하세요
중요한 데이터 포인트를 더 면밀하게 살펴보고, 시각적 복잡성을 줄이며, 가장 복잡한 데이터셋에서도 정확한 추세 분석을 가능하게 하세요.
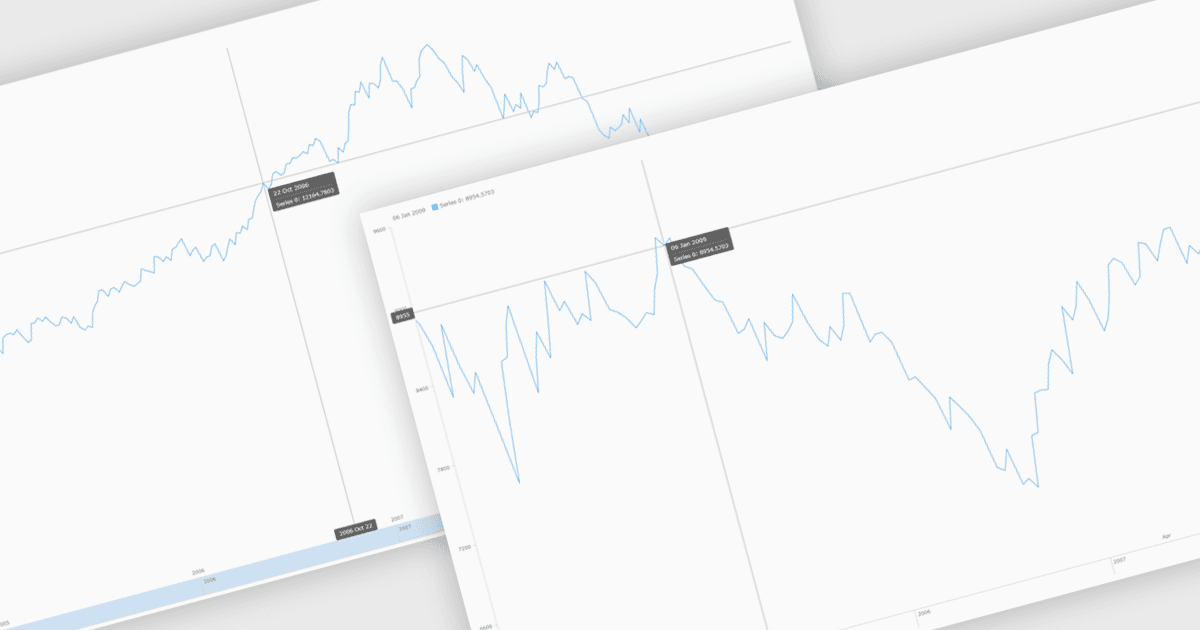
차트 줌(zoom) 기능을 사용하면 사용자가 차트의 표시 범위를 인터랙티브하게 조정하여 특정 데이터 포인트, 시간 구간 또는 값 범위에 집중함으로써 더 면밀한 분석이 가능합니다. 사용자가 줌을 동적으로 확대/축소할 수 있도록 하여 시각적 혼잡을 줄이고 가독성을 높이며, 전체 스케일 보기에서는 식별하기 어려울 수 있는 추세, 이상 징후 또는 패턴을 파악하는 데 도움이 됩니다. 이와 같은 인터랙티브 기능은 데이터를 다시 로드하지 않고도 상위 수준의 개요와 상세 인사이트 사이를 오가며 이동할 수 있게 해 더 빠르고 정보에 입각한 의사결정을 지원합니다. 일반적인 사용 사례로는 특정 기간에 대한 재무 성과 분석, 운영 지표의 급등 또는 급락 조사, 상세 센서 또는 모니터링 데이터 검토, 발표나 이해관계자 검토 시 핵심 데이터 세그먼트 강조 등이 있습니다.
다음과 같은 여러 JavaScript 차트 컨트롤이 줌을 지원합니다.
- Highcharts Core를 사용하면 밀집된 데이터셋을 탐색하기 위해 차트를 대화형으로 줌하여 시간 범위를 분리하고 반응형 컨트롤로 추세를 분석할 수 있습니다.
- KendoReact Charts (Telerik의 KendoReact에 포함)에서는 정밀하게 줌할 수 있어 집중된 데이터 탐색을 통해 애플리케이션이 더 명확한 인사이트를 제공하도록 돕습니다.
- AnyChart JS는 직관적인 차트 줌을 가능하게 하여 성능, 유연성, 시각적 선명도를 유지하면서 사용자가 상세 데이터 세그먼트를 살펴볼 수 있도록 합니다.
- LightningChart JS는 대규모 데이터셋에 대해 고성능 차트 줌을 수행할 수 있으며, 정밀도와 응답성 요구에 맞춰 실시간 분석을 지원합니다.
기능과 가격에 대한 심층 분석은 JavaScript Charts 비교 페이지를 방문하세요.