게이지 시각 자료로 보고 기능 향상
보고서에 게이지를 추가하여 복잡한 데이터를 단순화하고 목표 대비 성과를 강조하는 명확한 실시간 시각적 인사이트를 제공하세요.
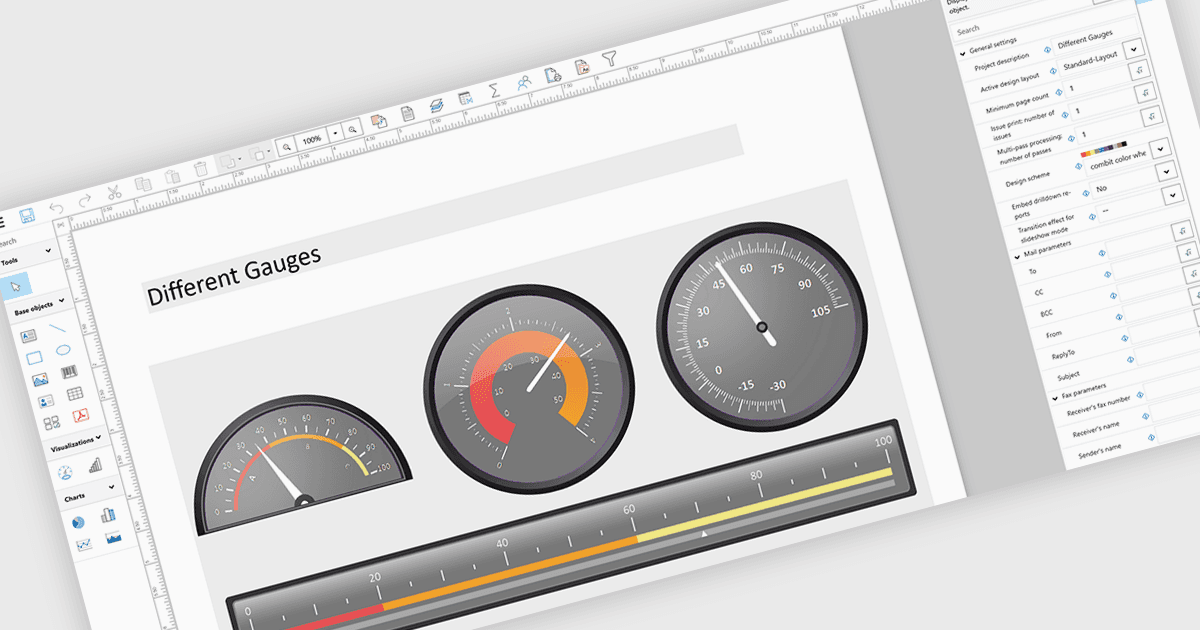
보고서에 게이지를 추가한다는 것은 다이얼 또는 미터 스타일 그래픽과 같은 시각적 지표를 포함하여, 정의된 범위나 목표에 대한 핵심 지표를 표시함으로써 성과를 한눈에 즉시 이해할 수 있게 만드는 것을 의미합니다. 이 접근 방식은 복잡하거나 방대한 데이터를 직관적인 시각 자료로 변환하여 보고서의 명확성을 높이고, 값이 허용 범위, 경고 범위 또는 위험 임계값 내에 있는지 사용자가 빠르게 판단할 수 있도록 돕습니다. 그 결과, 게이지는 더 빠르고 정보에 기반한 의사 결정을 지원하고, 이해관계자와의 소통을 개선하며, 더 매력적이고 사용자 친화적인 보고서를 만들어 줍니다. 일반적인 사용 사례로는 할당량 대비 매출 실적 추적, 시스템 상태 또는 가동 시간 모니터링, 예산 사용률 시각화, 그리고 빠른 인사이트가 중요한 경영진 대시보드에서 KPI 진행 상황 표시 등이 있습니다.
여러 .NET WPF Reporting 컨트롤에는 다음과 같은 게이지가 포함됩니다:
- DevExpress Reporting는 보고서에 사용자 지정 가능한 게이지 컨트롤을 포함하여 KPI를 시각화할 수 있게 해주며, 명확한 성과 추적과 더 빠른 데이터 기반 의사 결정을 지원합니다.
- Telerik Reporting은 보고서에 인터랙티브한 게이지를 통합할 수 있게 하며, 직관적인 시각 자료로 실시간 지표를 प्रस्तुत하여 명확성과 사용자 참여를 높입니다.
- List & Label Enterprise Reporting Edition by combit는 보고서에 게이지 요소를 추가할 수 있게 하여 사용자가 주요 값, 임계값, 성과 추세를 효과적으로 강조하도록 돕습니다.
- Stimulsoft Reports.WPF는 게이지 구성 요소가 포함된 풍부한 보고서를 설계할 수 있게 하여, 지표에 대한 정확한 시각적 피드백을 제공하고 모니터링과 분석을 향상시킵니다.
기능과 가격에 대한 심층 분석은 .NET WPF Reporting Controls 비교를 방문해 보세요.