지리 데이터를 실시간으로 시각화하기
맵 시각화를 사용하여 현대적인 애플리케이션과 대시보드에서 지리 데이터를 탐색하고, 패턴을 발견하며, 활동을 실시간으로 모니터링하세요.
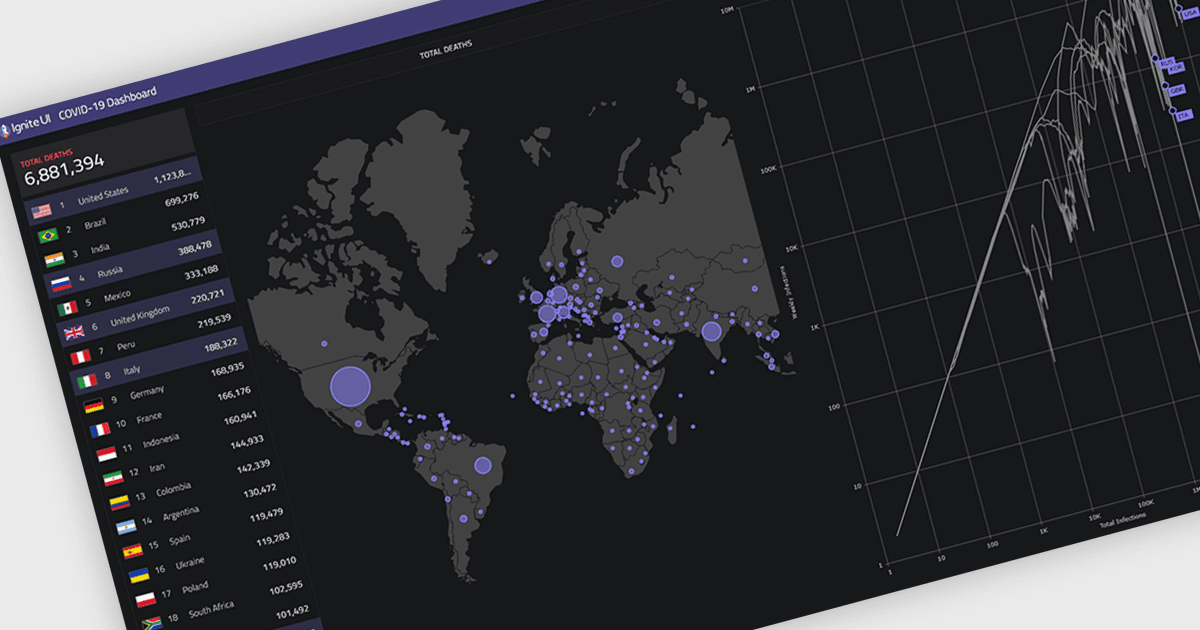
맵 컴포넌트를 사용하면 개발자가 애플리케이션과 대시보드에 인터랙티브한 위치 기반 데이터 시각화를 임베드할 수 있습니다. 지리적 맥락에서 데이터를 제시함으로써 패턴을 식별하고, 활동을 모니터링하며, 더 빠른 의사 결정을 지원하기가 쉬워집니다. 실시간 업데이트, 데이터 레이어링, 인터랙티브 탐색과 같은 기능을 갖춘 맵은 현대적인 대시보드에서 지역별 성과를 추적하고, 물류와 경로를 시각화하며, 라이브 또는 공간 데이터를 모니터링하는 데 흔히 사용됩니다.
여러 React UI suite에서 다음과 같은 맵 컨트롤을 제공합니다:
- DevExpress Dxperience는 인터랙티브 맵을 대시보드에 통합할 수 있게 하여, 지리 데이터 시각화, 지역 기반 분석, 실시간 공간 인사이트를 지원합니다.
- Telerik DevCraft UI는 사용자 지정 가능한 맵 컴포넌트를 임베드할 수 있게 하며, 지리 공간 데이터 렌더링, 인터랙티브 탐색, 위치 기반 인사이트를 지원합니다.
- Infragistics Ignite UI는 고성능 지리 매핑을 지원하여 실시간 데이터 플로팅, 레이어드 시각화, 고급 분석을 위한 풍부한 인터랙티비티를 제공합니다.
- Syncfusion Essential Studio UI Component Suite는 풍부한 기능의 맵을 통합할 수 있게 하여, 확장 가능한 지리 공간 시각화, 사용자 지정 가능한 레이어, 직관적인 탐색을 제공합니다.
기능과 가격에 대한 심층 분석은 React chart controls 비교를 확인하세요.