


공식 공급 업체
200 이상의 소프트웨어 개발처와 판매 계약을 맺은 공인 디스트리뷰터로서 합법적인 라이선스를 제공합니다.
모든 브랜드 보기.
영어로 계속 읽기:
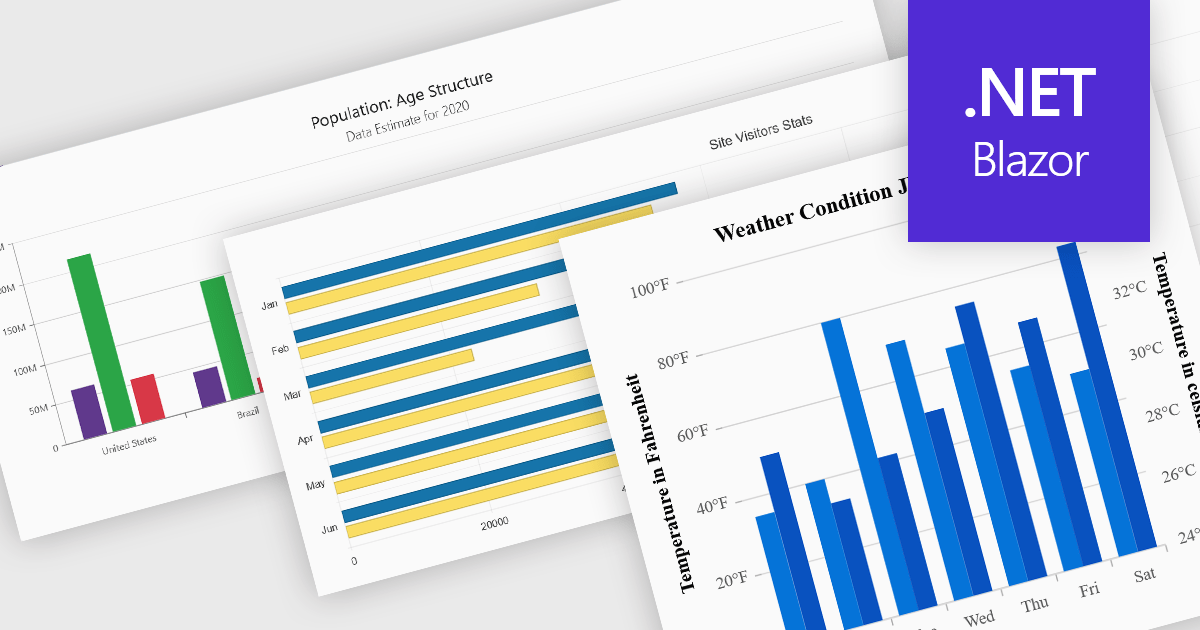
Column and bar charts are among the most widely used data visualization features in modern charting components, helping developers present comparisons, trends, and category-based metrics in a format that is easy to interpret. By displaying values as horizontal or vertical bars, these chart types allow applications to communicate changes in performance, rankings, distributions, and other business data with clarity. Modern charting components typically support customization options such as stacked series, grouped categories, animations, tooltips, responsive layouts, and interactive behaviors, enabling developers to create dashboards and reporting experiences that suit a wide range of enterprise and analytical scenarios.
Several Blazor chart controls offer column and bar charts including:
For an in-depth analysis of features and price, visit our Blazor chart controls comparison.
전화 : 00798 14 800 6332
팩스 : +1 770 250 6199


