


공식 공급 업체
200 이상의 소프트웨어 개발처와 판매 계약을 맺은 공인 디스트리뷰터로서 합법적인 라이선스를 제공합니다.
모든 브랜드 보기.
LightningChart JS is a high-performance JavaScript charting library that utilizes WebGL rendering and GPU acceleration to deliver exceptional performance for a wide range of data visualization needs. It is designed to handle large datasets and complex visualizations with ease, enabling developers to create interactive and visually appealing 2D and 3D charts. Ideal for applications demanding smooth real-time data updates, such as financial platforms, engineering tools, scientific research dashboards, and industrial monitoring systems, LightningChart JS provides a comprehensive API for customization and integration into web-based projects.
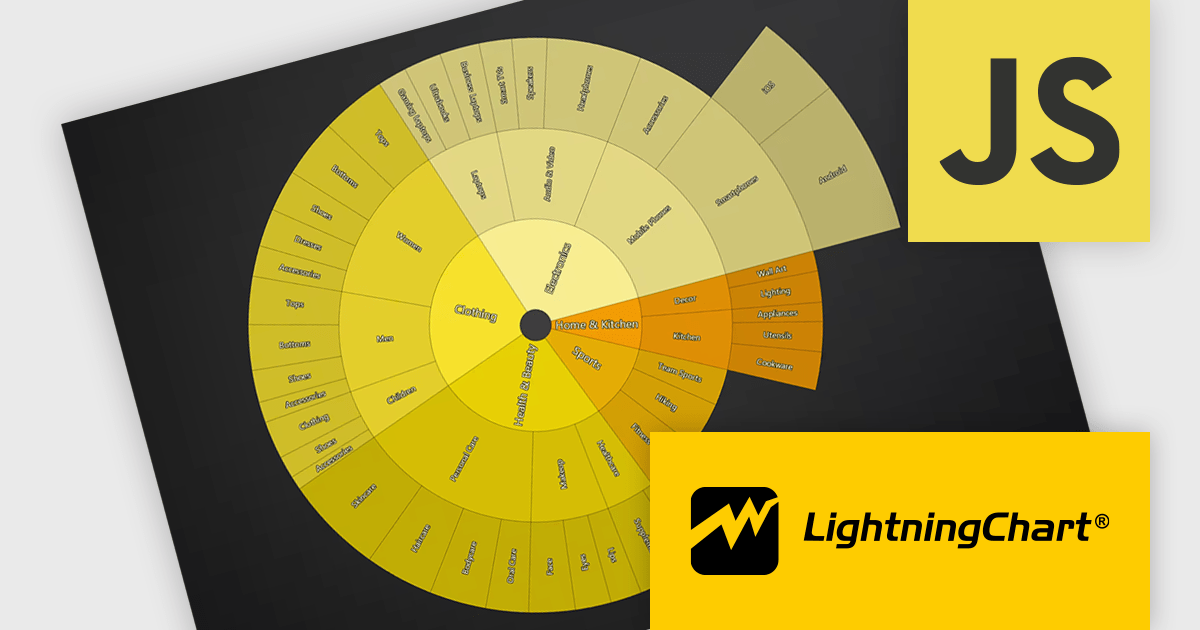
The LightningChart JS v8.3 update introduces Sunburst charts, enabling developers to visualize hierarchical data in a compact and intuitive format that clearly represents part to whole relationships across multiple levels. By displaying nested categories as proportionally sized segments within concentric rings, the chart makes it easier to analyze complex data structures, compare contributions at different hierarchy levels, and identify patterns or dominant categories without requiring multiple visualizations. This helps developers deliver more informative data exploration experiences in applications that rely on organizational, financial, operational, or other structured datasets.
To see a full list of what's new in v8.3, see our release notes.
LightningChart JS is licensed per developer and is available as an annual license with 1 year support. See our LightningChart JS licensing page for full details.
For more information, see our LightningChart JS product page.
전화 : 00798 14 800 6332
팩스 : +1 770 250 6199


