Vue.js 앱에서 대화형 파이 차트 만들기
툴팁, 범례, 레이블 및 애니메이션이 포함된 반응형 파이 차트로 카테고리 비율을 시각화하세요.
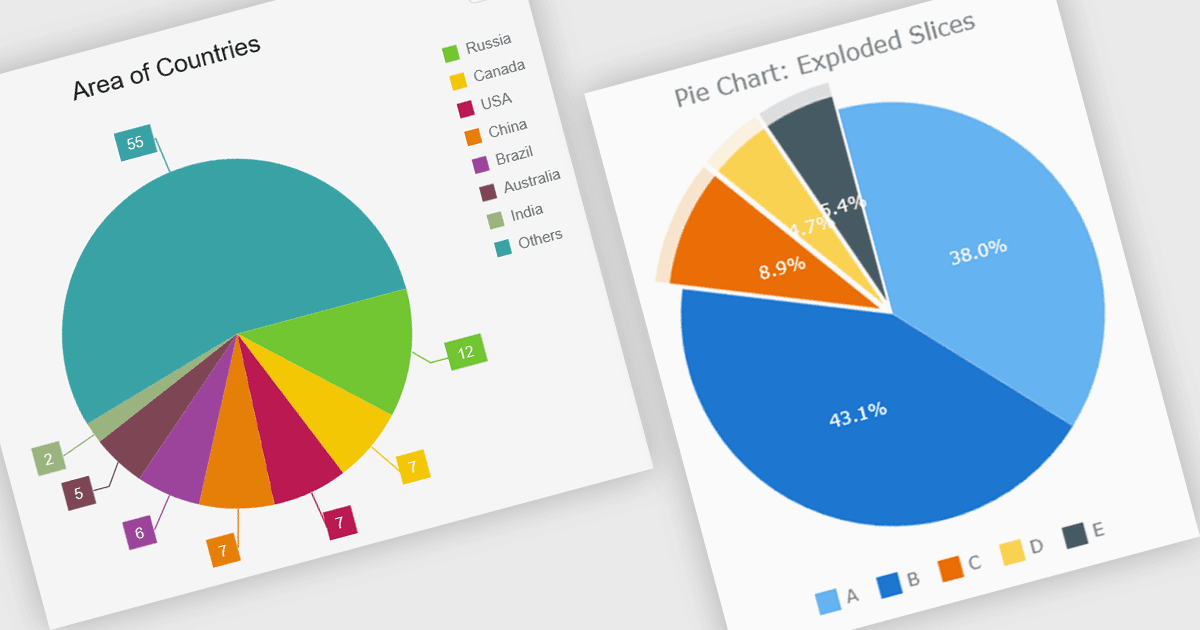
파이 차트는 개발자가 데이터를 원의 비례하는 조각으로 표시할 수 있게 하며, 각 조각은 단일 총합에서 카테고리의 비중을 나타냅니다. 부분-전체 관계를 보여주는 데이터셋에 적합하여 사용자가 상대적인 비율을 한눈에 쉽게 비교할 수 있습니다. 잘 설계된 구현은 일반적으로 툴팁, 범례, 레이블, 애니메이션, 반응형 레이아웃 및 사용자 지정 옵션과 같은 대화형 기능을 포함하여 차트를 현대 웹 애플리케이션에 깔끔하게 통합하면서 구성 데이터를 명확하고 접근하기 쉬운 방식으로 제공합니다.
다음은 파이 차트를 지원하는 여러 Vue.js 차트 컴포넌트입니다:
- Highcharts Core는 풍부한 사용자 지정, 반응형 레이아웃, 애니메이션, 툴팁, 범례 및 유연한 스타일링 옵션으로 대화형 파이 차트를 만들 수 있습니다.
- DevExtreme Vue Chart (DevExtreme Complete by DevExpress의 일부)는
- 사용자 지정 가능한 조각, 레이블, 범례, 애니메이션 및 대화형 툴팁이 포함된 반응형 파이 차트를 구축할 수 있습니다.
- Kendo UI Vue Charts (Telerik의 Kendo UI의 일부)는 구성 가능한 레이블, 범례, 툴팁, 스타일링 및 반응형 렌더링이 가능한 차트 제작을 지원합니다.
- AnyChart JS는 대화형 툴팁, 구성 가능한 레이블, 분리된 조각, 반응형 레이아웃 및 광범위한 외관 옵션을 갖춘 사용자 지정 가능한 파이 차트를 개발할 수 있게 합니다.
기능과 가격에 대한 심층 분석은 Vue.js 차트 컴포넌트 비교를 참조하세요.