
dotMemory
A profiling solution for profiling the memory use of your .NET applications.
JetBrains사에서 공개
2007년 부터 ComponentSource에서 판매중
A profiling solution for profiling the memory use of your .NET applications.
JetBrains사에서 공개
2007년 부터 ComponentSource에서 판매중

Starting November 2, 2015, dotMemory is only available as part of ReSharper Ultimate.
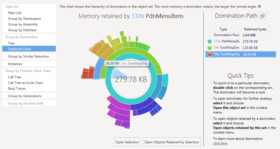
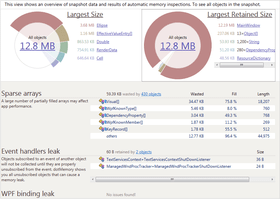
dotMemory lets you discover memory leaks and optimize memory usage in applications based on the .NET Framework including desktop, Web applications, and Windows services. dotMemory includes two profiling modes. You can identify instant memory status, or monitor memory allocation dynamics over time. If you are looking to optimize a certain class, you can quickly find all objects of this class in a memory snapshot. While analyzing a snapshot, you can instantly view the source code of any functions involved.

Memory profiling features in dotTrace Memory
With dotMemory, you can quickly profile the memory usage of your applications based on .NET Framework. The profiling process is not only simple but fast. A wealth of profiling data is accurately recorded and presented in the form of memory snapshots, allowing thorough analysis of memory issues.
dotMemory 도 구매할 수 있습니다:
JetBrains 사 제품 라이선스 담당자와 라이브 채팅


전화 : 00798 14 800 6332
팩스 : +1 770 250 6199


