
FusionMaps XT
대화형 지도를 효과적으로 사용하여 지역, 선거 결과 및 오피스 위치에 따른 수익과 같은 지리적 데이터를 표시합니다.
FusionCharts사에서 공개
2020년 부터 ComponentSource에서 판매중
가격: ₩ 106,600
대화형 지도를 효과적으로 사용하여 지역, 선거 결과 및 오피스 위치에 따른 수익과 같은 지리적 데이터를 표시합니다.
FusionCharts사에서 공개
2020년 부터 ComponentSource에서 판매중
가격: ₩ 106,600

Please note that FusionMaps new licenses are available as part of FusionCharts Suite
FusionCharts Suite is available as an Annual and Perpetual licenses.
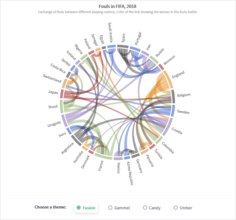
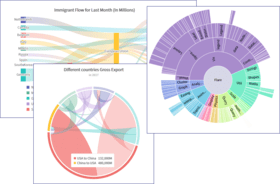
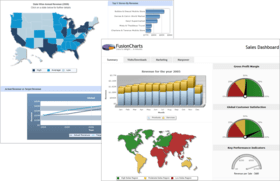
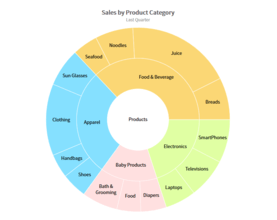
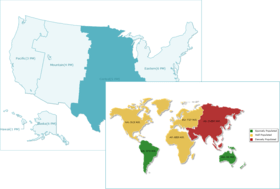
FusionMaps XT helps you display geographical data distributed by category, regions or entities using JavaScript (HTML5). You can use it to plot business data like revenue by regions, census data like population by state, election results, flight routes, office locations and survey results effectively. FusionMaps XT offers over 965 maps including all continents, major countries and all US states. The maps are driven by XML data source and you can integrate them with any web technology (ASP.NET, PHP, Python, Java, Ruby on Rails etc.) and database. You can set up a map in a couple of minutes and then extensively customize them using the XML/JSON API they expose. FusionMaps XT also comes with a visual map builder that helps you enter data and set all configurations of the map. FusionMaps XT is a part of the FusionCharts Suite XT, but functions independently of the other products in the suite as well.


이미지 1/11
Advantages of Using FusionMaps XT:

FusionMaps XT 도 구매할 수 있습니다:
FusionCharts 사 제품 라이선스 담당자와 라이브 채팅


전화 : 00798 14 800 6332
팩스 : +1 770 250 6199


