MindFusion.Charting for JavaScript
JavaScript 애플리케이션에서 인터랙티브한 차트, 게이지, 대시보드를 만드세요.
- 선, 파이, 막대, 버블, 레이더를 포함한 일반적인 차트 유형을 지원합니다.
- 3D, 금융, 사용자 지정 가능한 게이지 구성 요소를 포함합니다.
- 고성능, 유연한 스타일링, 사용자 상호 작용 제어 기능을 제공합니다.

가격:
| 개별로 이용 가능 | 판매가 |
|---|---|
| MindFusion.Charting for JavaScript | 로딩 중 |
| 다음에서도 이용 가능 | |
|---|---|
| MindFusion.JavaScript Pack | 로딩 중 |
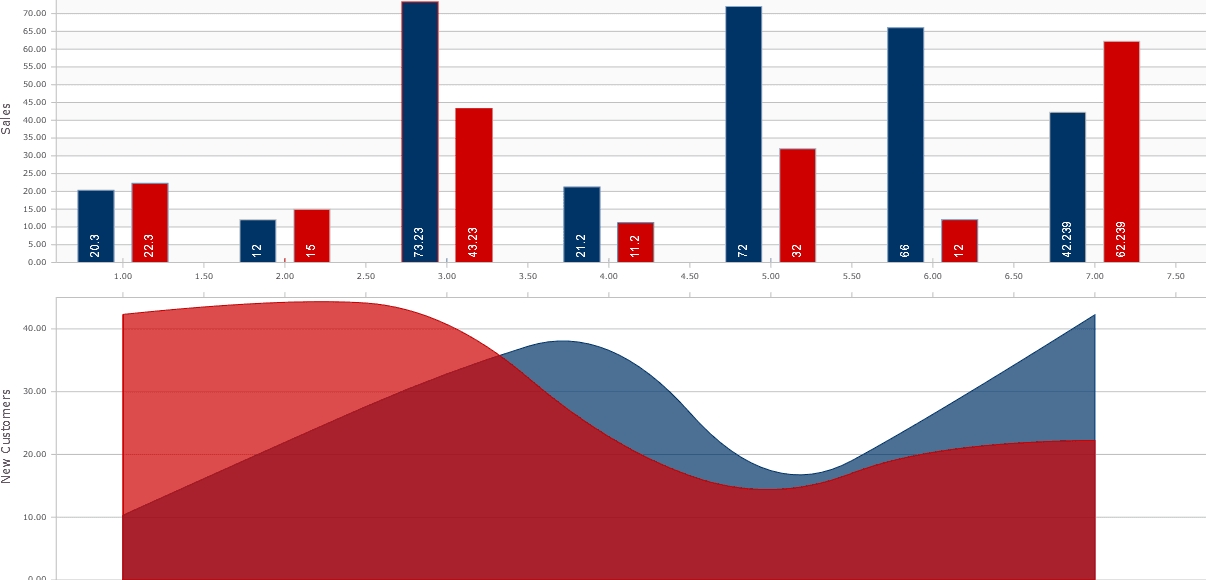
다양한 차트 유형
하나의 차트 컨트롤 안에서 선, 영역, 버블, 막대, 세로 막대, 파이, 도넛, 퍼넬, 레이더, 폴라 등 다양한 차트 유형을 생성하고 결합하여 데이터를 의미 있게 시각화할 수 있습니다.
3D 및 금융 차트
대용량 데이터 세트와 실시간 업데이트를 효율적으로 처리하는 현실적인 3D 막대 차트와 원기둥 차트, 그리고 금융 캔들스틱 차트를 구축할 수 있습니다.
사용자 지정 가능한 게이지
타원형 및 선형 게이지는 폭넓은 스타일링과 사용자 지정 기능을 통해 온도계, 시계, 나침반, 자동차 대시보드와 같은 다양한 계기판으로 변환할 수 있습니다.
인터랙티브 사용자 경험
스크롤, 팬, 확대/축소, 회전을 포함한 차트 상호 작용을 활성화하여 데이터 탐색을 직관적으로 만드세요. 범례는 사용자의 선호에 맞게 재배치할 수 있습니다.
동적 레이아웃 관리
자동 레이아웃 컨테이너는 차트 크기가 변경될 때 사용 가능한 공간을 다시 계산하여 모든 차트 요소의 적절한 비율과 위치를 유지합니다.
데이터 바인딩 및 소스
차트는 개체 컬렉션, XML, DateTime 및 숫자 배열에 대한 데이터 바인딩을 지원하며, 범용 시리즈 인터페이스를 통해 사용자 지정 데이터 통합을 용이하게 합니다.
고급 스타일링 및 테마
테마 편집기를 사용한 테마 기반 스타일링과 함께 글꼴, 브러시, 스트로크 및 기타 시각적 요소에 대한 세부적인 속성 제어를 활용하여 맞춤형 외관을 만들 수 있습니다.
고성능 렌더링
최적화된 렌더링 엔진은 웹 서버 리소스에 큰 영향을 주지 않으면서 수백 개의 데이터 포인트가 있는 차트를 부드럽게 처리합니다.
포괄적인 API 설계
유연한 클래스 구조를 제공하여 개발자가 축, 플롯, 범례, 시리즈와 같은 차트 요소를 만들고, 결합하고, 상속하고, 배치하여 특정 애플리케이션 요구를 충족할 수 있게 합니다.
제품 호환성
아래의 세부 정보를 확인하여 이 제품이 사용 환경에서 지원되는지 확인하세요.
컴포넌트 유형
- JavaScript
JavaScript 플랫폼
- Vanilla JavaScript
MindFusion Group에 대해
2001년 불가리아 소피아에서 설립된 MindFusion Group은 JavaScript, .NET, Java, 모바일 플랫폼을 포함한 다양한 환경에서 다이어그램, 스케줄링, 차트 작성, 데이터 시각화를 위한 재사용 가능한 소프트웨어 구성 요소 개발에 집중합니다. 이 회사는 아웃소싱 업체로 시작했지만, 소프트웨어 엔지니어의 실질적인 요구를 해결하는 구성 요소를 만드는 방향으로 빠르게 전환했습니다. MindFusion은 뛰어난 고객 지원과 유연한 라이선스를 함께 제공하는 고품질의, 문서화가 잘 된 라이브러리를 제공하는 것으로 명성을 쌓아 왔습니다. 이 회사의 구성 요소는 전 세계 조직의 신뢰를 받고 있으며, 대기업부터 프리랜서와 교육 기관에 이르기까지 다양한 사용자층에 걸쳐 사용됩니다.