
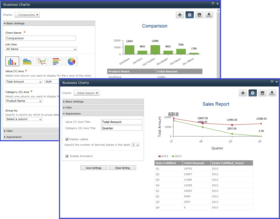
SharePoint Business Charts
SharePoint에서 차트를 만듭니다.
BoostSolutions사에서 공개
2009년 부터 ComponentSource에서 판매중

SharePoint Business Charts provides an easy way for end users to create charts directly in a SharePoint list without help from an IT administrator. End users just click the ribbon button to get started. Business Charts has an intuitive and simple-to-use interface which drive users to finish settings themselves, reducing an administrator’s workload.

Multiple Chart Types Supported
5 chart types are provided in Business Charts: Bar, Column (Stacked Bar), Line, Area and Pie. Users can pick which type of chart they want to use and can change between chart types. Even Better, Business Charts allows users to create multiple charts in one list or Web Part, which improves users analysis.
Supports Aggregate Functions to Analyze Data
When users create a chart, they can use several functions (SUM, COUNT, AVERAGE, MAX, MIN, etc.) to sort or summarize...

SharePoint Business Charts 도 구매할 수 있습니다:
BoostSolutions 사 제품 라이선스 담당자와 라이브 채팅


전화 : 00798 14 800 6332
팩스 : +1 770 250 6199


