Vizuly Tree Map

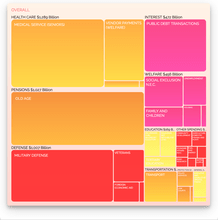
Vizuly Tree Map visualizes hierarchical data in nested rectangular plots where the area of each rectangle is bound to a data property you can set. This TreeMap also supports the ability to drill down/up, in addition to a navigation “bread-crumb” at the top of the visualization. In addition to several different fill/stroke styles you can adjust the padding between and within elements and provide header titles to each section.

Features

  • Supports Drill Down/Up
  • Interactive Navigation Header
  • 6 example themes
  • More than a dozen dynamic styles
  • Dozens of adjustable properties and interactive event support
  • Customizable Data Tips
  • Documentation

Framework Adapters

  • React Adapters
  • Angular Adapters
  • Vue.js Adapters

최신 뉴스

Vizuly Tree Map released
June 7, 2019신제품
JavaScript 앱에 Tree Map 차트를 추가 합니다.

가격: ₩ 79,600

Vizuly Developer Licensing: Developer License allows a single developer to use the Software on an unlimited number of websites, intranets, web applications and SaaS projects, Developer License allows...

Vizuly Tree Map 도 구매할 수 있습니다:

궁금한 점이 있으세요?

Vizuly 사 제품 라이선스 담당자와 라이브 채팅

Vizuly
Vizuly사 제품의 배포자로서 공식 권한을 소유한 ComponentSource는 합법적인 라이선스를 고객님께 직접 제공합니다.
콤포넌트 타입
  • JavaScript
  • 반응
  • 각도
  • 뷰 js