
Vizuly Venn Diagram
JavaScript 앱에 Venn Diagram 차트를 추가 합니다.
Vizuly Professional includes all Vizuly components at a significant discount.
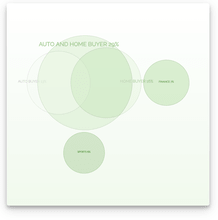
Vizuly Venn Diagram shows all possible logical relations between a finite collection of different sets. This chart depicts elements as points in the plane, and sets as regions inside closed curves. A Venn diagram consists of multiple overlapping closed curves, usually circles, each representing a set. Using data bound dynamic styles you can declare different colors and visual attributes unique to each set.


이미지 1/6
Features
Framework Adapters
전화 : 00798 14 800 6332
팩스 : +1 770 250 6199


