컴포넌트 / Vizuly / Clever Components

  1. $$ | 구입

    릴리스 노트: Added Embarcadero RAD Studio 12 Athens support. 0 ... 더 읽기

  2. 릴리스 노트: Added full Embarcadero RAD Studio 12 Athens support. DNS over TCP has been introduced- The transport protocol can be selected automatically or manually, according to the RFC-7766 specification. TLS 1.3 has been implemented- The protocol can be used for ... 더 읽기

  3. $$$ | 구입

    릴리스 노트: The improved MailMessage component now allows you to specify a user-defined name for any attached file or embedded resource. The Imap4Server component has been optimized- The updated GetMessages event args allow you to filter the returned message set and ... 더 읽기

  4. $$$ | 구입

    릴리스 노트: The ActiveX version 11.0 has been compiled with the latest Clever Internet Suite 11.0 for VCL. DNS over TCP has been introduced- The transport protocol can be selected automatically, according to the RFC-7766 specification. TLS 1.3 has been implemented- ... 더 읽기

  5. $$$$ | 구입

    릴리스 노트: Clever Internet ActiveX Suite for ASP, VBScript, JavaScript The ActiveX version 11.0 has been compiled with the latest Clever Internet Suite 11.0 for VCL. DNS over TCP has been introduced- The transport protocol can be selected automatically, according to ... 더 읽기

  6. $$$ | 구입

    설명: Add charts and visualizations to your JavaScript apps. Vizuly Professional includes Corona, Halo, Radial Bar, Ring Chart, Weighted Tree, Geo Plot, Bar Chart, Column Chart, Line Area Chart, Radar Chart, Radial Progress, Scatter Plot, Sunburst, Tree Map, ... 더 읽기

  7. $ | 구입

    설명: Add Word Clouds to your JavaScript apps. Vizuly Word Cloud is a unique way to represent the occurrence rate of words within a given text stream. This visualization supports an exclusion list that will ignore common pronouns, profanity, or any words you ... 더 읽기

  8. $ | 구입

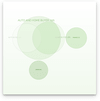
    설명: Add Venn Diagram charts to your JavaScript apps. Vizuly Venn Diagram shows all possible logical relations between a finite collection of different sets. This chart depicts elements as points in the plane, and sets as regions inside closed curves. A Venn ... 더 읽기

  9. $ | 구입

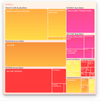
    설명: Add Tree Map charts to your JavaScript apps. Vizuly Tree Map visualizes hierarchical data in nested rectangular plots where the area of each rectangle is bound to a data property you can set. This TreeMap also supports the ability to drill down/up, in ... 더 읽기

  10. $ | 구입

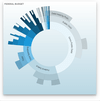
    설명: Adds Sunburst charts to your JavaScript apps. Vizuly Sunburst is designed to represent hierarchical data in a radial plot. It supports drill down and drill up capabilities by allowing the user to collapse and expand segments of the sunburst when they ... 더 읽기