컴포넌트 / Vizuly / Dynamsoft Corporation / ComponentArt
Create highly customized and unique data visualizations.
Scatter Plot Chart - Shows three dimensions of data at once by plotting values along both the X and Y axis as well as the radius of the plot itself. Each plot can be colored and styled dynamically based on your data.
저품질 이미지를 위한 최첨단 알고리즘을 제공하는 크로스-플랫폼 바코드 SDK
- Windows, Linux, macOS, iOS, Android, Raspberry Pi 및 웹 브라우저 용 빌드
- 1D 바코드, QR Code, DataMatrix, PDF417 및 Aztec Code 지원
- 알고리즘 사용자 정의를 위한 유연한 매개변수 템플릿
-
릴리스 노트:
Influence image processing process by altering intermediate results- Users can now clone, edit, and substitute intermediate result units within the callback function of each type. Subsequent operations will then proceed based on the updated unit. Added a ...
더 읽기
-
릴리스 노트:
Security update for Dynamsoft Service. 0 ...
더 읽기
-
설명:
Add charts and visualizations to your JavaScript apps. Vizuly Professional includes Corona, Halo, Radial Bar, Ring Chart, Weighted Tree, Geo Plot, Bar Chart, Column Chart, Line Area Chart, Radar Chart, Radial Progress, Scatter Plot, Sunburst, Tree Map, ...
더 읽기
-
설명:
Add Word Clouds to your JavaScript apps. Vizuly Word Cloud is a unique way to represent the occurrence rate of words within a given text stream. This visualization supports an exclusion list that will ignore common pronouns, profanity, or any words you ...
더 읽기
-
설명:
Add Venn Diagram charts to your JavaScript apps. Vizuly Venn Diagram shows all possible logical relations between a finite collection of different sets. This chart depicts elements as points in the plane, and sets as regions inside closed curves. A Venn ...
더 읽기
-
설명:
Add Tree Map charts to your JavaScript apps. Vizuly Tree Map visualizes hierarchical data in nested rectangular plots where the area of each rectangle is bound to a data property you can set. This TreeMap also supports the ability to drill down/up, in ...
더 읽기
-
설명:
Adds Sunburst charts to your JavaScript apps. Vizuly Sunburst is designed to represent hierarchical data in a radial plot. It supports drill down and drill up capabilities by allowing the user to collapse and expand segments of the sunburst when they ...
더 읽기
-
설명:
Add Scatter Plot charts to your JavaScript apps. Vizuly Scatter Plot shows 3 dimensions of data at once by plotting values along both the x and y axis as well as the radius of the plot itself. Each plot can be colored and styled dynamically based on your ...
더 읽기
-
설명:
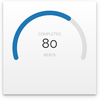
Show numeric values within a minimum and maximum range. Vizuly Radial Progress is designed to show numeric values within a minimum and maximum range. It can also show when a value has exceeded the maximum threshold. This chart supports a variable range of ...
더 읽기
-
설명:
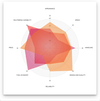
Add Radar charts to your JavaScript apps. Vizuly Radar Chart graphs multiple dimensions of one datum along multiple radial axis. Each plot represents 3 or more data points along shared axis lines. This chart supports highlighting of both individual data ...
더 읽기


