컴포넌트 / Vizuly / Noemax / InfoSoft Global - 베스트 셀러
Create highly customized and unique data visualizations.
Scatter Plot Chart - Shows three dimensions of data at once by plotting values along both the X and Y axis as well as the radius of the plot itself. Each plot can be colored and styled dynamically based on your data.
시스템 제공 .NET 클래스보다 압축비 개선.
- 9개의 압축 수준 가운데에서 선택
- GZIP과 DEFLATE 인터넷 표준(RFC 1951) 및 (RFC 1952) 구현
- .NET과 .NET CF 모두에서 실행
SharePoint에서 통찰력있는 플러그 앤 플레이 대시보드를 만드세요.
- SharePoint® Lists, Views, CSV 문자열 또는 파일, MS SQL, 오라클, 엑셀 및 BDC에 저장된 데이터에서 차트를 만드세요
- SharePoint 서버 2016, 2013, 2010, WSS 3.0 및 MOSS 2007과 함께 작업할 수 있습니다
- N번째 레벨에 이르는 멀티 레벨 드릴 다운, 이미지, PDF, 엑셀 또는 PowerPoint로 차트 내보내기
-
설명:
Add interactive chart web parts to SharePoint pages. Collabion Charts for SharePoint lets you create insightful dashboards in SharePoint, without MOSS or Excel Services. It works with WSS 3.0, MOSS 2007, SharePoint Server 2010, 2013 and 2016, and can plot ...
더 읽기
-
설명:
Fast compression for.NET. DotNetCompression is a real-time compression library in C# that provides ultra fast LZF4 streams, faster-than-native DEFLATE/ZLIB/GZIP streams and LZMA/BZIP2 streams for maximum compression. DotNetCompression Features LZF4- The ...
더 읽기
-
설명:
Performance tuning for WCF services. WCF-Xtensions includes advanced bindings, binding elements, behaviors, factories and clients that extend the capabilities of your WCF services and improve the performance of your WCF applications. WCF-Xtensions ...
더 읽기
-
설명:
Real-time bi-directional communications between devices, browsers, desktops and servers. PowerWebSockets is a high-throughput, cross-platform, full-duplex communication framework in C# that shines at pushing real-time data over a large number of ...
더 읽기
-
설명:
All Noemax components in a single subscription for maximum performance benefits. Noemax360 gives you full access to PowerWebSockets (real-time bi-directional communications between devices, browsers, desktops and servers), WCF-Xtensions (boost the ...
더 읽기
-
설명:
Convert all your data in SharePoint into interactive data grids with pivoting capabilities. With Collabion Data Grid for SharePoint you can convert all your data in SharePoint into interactive data grids with pivoting capabilities. Easily add aggregated ...
더 읽기
-
설명:
A radial line and area layout visualization. Vizuly Corona is a radial chart that provides angular and curved radial area line curves and supports both an overlap and stacked layout. It also features over a dozen different dynamic styles and comes bundled ...
더 읽기
-
설명:
Represent transactional relationships from a specified number of sources to a variable number of targets. Vizuly Halo uses several different data visualization techniques to represent transactional relationships from a specified number of sources to a ...
더 읽기
-
설명:
Represent cartesian x/y data within a radial plot. Vizuly Radial Bar is designed to represent cartesian x/y data within a radial plot. It supports both clustered and stacked radial bars Use the interactive style explorer on the left to view different ...
더 읽기
-
설명:
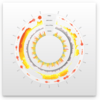
Easily display multi-variate time series information. Vizuly Ring Chart lets you easily display multi-variate time series information. Due to its radial form factor, you can display 3 times the information for a given screen width than you could with a ...
더 읽기


