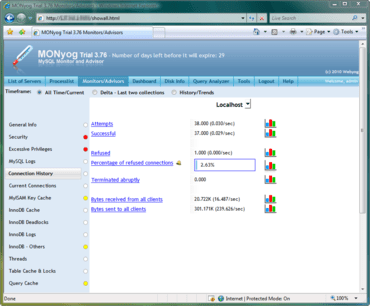
Monyog v7.0

New customizable dashboard, overview of MySQL environment and replication hierarchy view.
January 25, 2017
New Version

Features

  • Redesigned UI - The most critical information can now be accessed with less user interaction and all the related information is available in one view.
  • Customizable Dashboard and intuitive charts.
  • Overview of MySQL environment & industry leading Replication Hierarchy view.
  • Avoid the visibility gap across your complex data tier.
  • Achieve faster issue resolution.
  • Immediately uncover valuable server performance insight.
  • Top-level view of MySQL servers
    • See the top 10 queries across your MySQL environment based on the total execution time.
    • Identify problematic queries instead of manually searching for them across each server.
    • Overview page provides the count of the total servers registered with Monyog, the total number of disconnected servers, servers with critical alerts and the servers with warnings.
    • Easily enable or disable MySQL and system charts such as MySQL availability, connections, cache misses, statements, CPU & IO usage and much more.
    • Expand a particular chart, go back in time and identify queries that bear an impact on your MySQL server performance.
  • Powerful Query Analyzer
    • Query Analyzer shows the top 5 queries based on execution time. It helps you find the problematic queries across your servers and spot performance problems in the complex data layer.
  • Replication Topology View - Get industry leading visibility into the replication hierarchy of the servers along with the details of each replicated server to make sure the data is always up to date. Color codes help to represent different states of the replication servers.
  • Better MySQL server search - Provides a simple search option to find any server registered with Monyog.
Monyog

SQL Diagnostic Manager for MySQL

Achieve comprehensive 24/7 MySQL and MariaDB monitoring.

Got a Question?

Live Chat with our Webyog licensing specialists now.