Official Supplier
As official and authorized distributors, we supply you with legitimate licenses directly from 200+ software publishers.
See all our Brands.
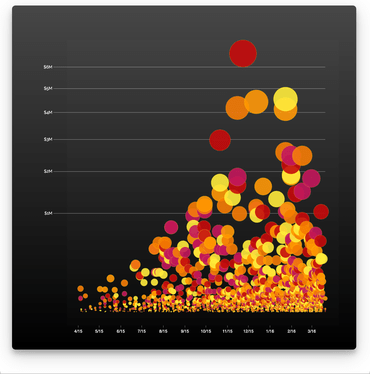
Vizuly Scatter Plot shows 3 dimensions of data at once by plotting values along both the x and y axis as well as the radius of the plot itself. Each plot can be colored and styled dynamically based on your data.
Features
Framework Adapters

Add Scatter Plot charts to your JavaScript apps.
Live Chat with our Vizuly licensing specialists now.