Official Supplier
As official and authorized distributors, we supply you with legitimate licenses directly from 200+ software publishers.
See all our Brands.
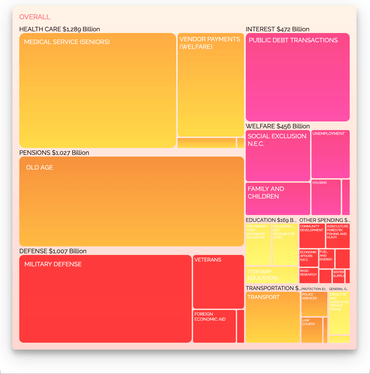
Vizuly Tree Map visualizes hierarchical data in nested rectangular plots where the area of each rectangle is bound to a data property you can set. This TreeMap also supports the ability to drill down/up, in addition to a navigation “bread-crumb” at the top of the visualization. In addition to several different fill/stroke styles you can adjust the padding between and within elements and provide header titles to each section.
Features
Framework Adapters

Add Tree Map charts to your JavaScript apps.
Live Chat with our Vizuly licensing specialists now.