Telerik Reporting
Complete .NET reporting solution for Web, mobile and desktop apps.
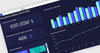
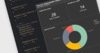
Sales Dashboard Report - The Sales Dashboard sample report presents an easy-to-consume performance overview of a sales department.
Tel: (888) 850 9911
Fax: +1 770 250 6199