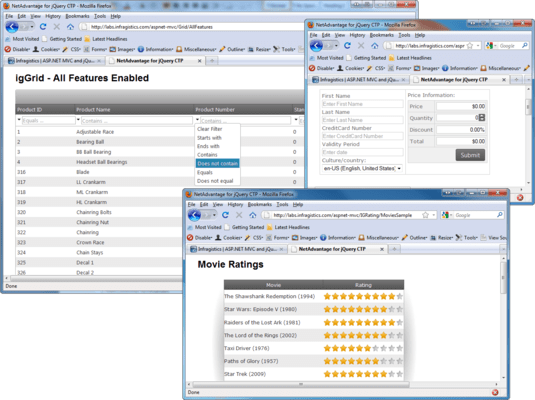
Infragistics NetAdvantage for jQuery
A full range of commercial class application user interface controls for jQuery development.
Published by Infragistics
Distributed by ComponentSource since 1996
We do not supply this product anymore.
A full range of commercial class application user interface controls for jQuery development.
Published by Infragistics
Distributed by ComponentSource since 1996

NetAdvantage for jQuery has been re-named and is now called Infragistics Ignite UI
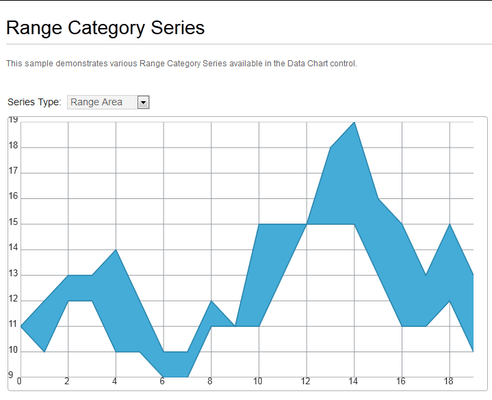
Let your data tell the story, with the broadest range of interactive, high-performance HTML5 data charts that include support for a full range of business, scientific and financial charting scenarios, as well as animation, trend line and Touch support capabilities "right out of the box."


As official and authorized distributors, we supply you with legitimate licenses directly from 200+ software publishers.
See all our Brands.
Over 1,400,000 licenses delivered to Developers, SysAdmins, Corporations, Governments & Resellers, worldwide.
Read more about us.
Tel: (888) 850 9911
Fax: +1 770 250 6199
