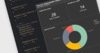
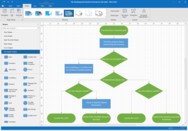
Data visualization components implement the functionality to view data in tables or data grids, as simple charts or complex graphs and enables you to create sophisticated management dashboards using gauges, maps and flowcharts.
Advanced data visualization for more informative reports.
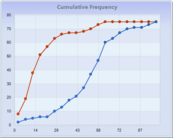
Nevron Chart for SSRS - Delivers a complete set of 2D and 3D chart types, customizable axes, data integration and visual effects to your reports. An indispensable tool for any Business Intelligence, scorecard or scientific report.
Add interactive charts and maps to your apps and websites.
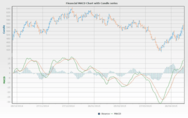
Responsive Stock Charts - Highcharts Stock's responsiveness goes beyond simply fitting the chart to the dimensions of its container. It also automatically finds an optimal placement for non-graph elements such as legends and headings.
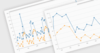
Create interactive JavaScript charts for Web, Mobile & Enterprise applications.
Chart and Map Types - From basic charts (2D and 3D line, column, pie) to more complex ones (waterfall, gantt, candlestick, zoomline), FusionCharts Suite XT includes an exhaustive collection of JavaScript charts.
Build applications for Windows, Web, mobile and tablet.
WinExplorer HTML Templates - HTML-CSS templates allow you to override the default data presentation in all view styles. Use HTML markup to specify content for WinExplorer View items and use CSS code to customize the appearance, size, padding and layout of UI elements.
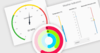
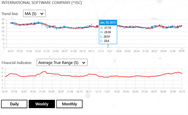
Add financial, scientific, engineering and business charts to your applications.
Scientific Graph - Pass large amounts of data into the graph and easily view the information in smaller/clearer increments via zooming or dialog adjustments. Zooming can be invoked by left-button dragging a zoom box.
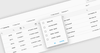
React Pivot Table - Organize and summarize business data and display the result in a cross-table format. Includes data binding, drilling up and down, Excel-like filtering and sorting, editing, Excel and PDF exporting, several built-in aggregations, pivot table field list, and calculated fields.
A comprehensive, native Blazor UI components library.
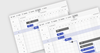
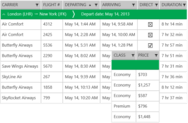
Fast & Powerful Grid Component - A feature-rich component useful for displaying data in a tabular format. Its wide range of functionalities include data binding, editing, Excel-like filtering, custom sorting, aggregating rows, selection and support for Excel, CSV and PDF formats.
Deliver amazing user experiences on the WinForms platform.
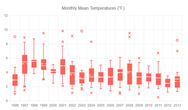
WinForms Chart Control - A comprehensive collection of 2D and 3D charts that have been optimized for performance and flexibility. The suite ships with 35+ 2D chart views and 20+ 3D views, from bars and pies to financial series.
High-performance toolkits for your development projects.
High Performance Charting - Plot a wide range of chart types from line charts to specialized financial charts. Syncfusion’s rich feature set includes data binding, multiple axes, trackball, drill-down operations and zooming.