Adicione Gráficos de Candlestick aos seus Apps WinForms
Os gráficos de candlestick capturam visualmente a variação de preço, abertura/fechamento e máximas/mínimas, revelando o sentimento do mercado e oportunidades de negociação.
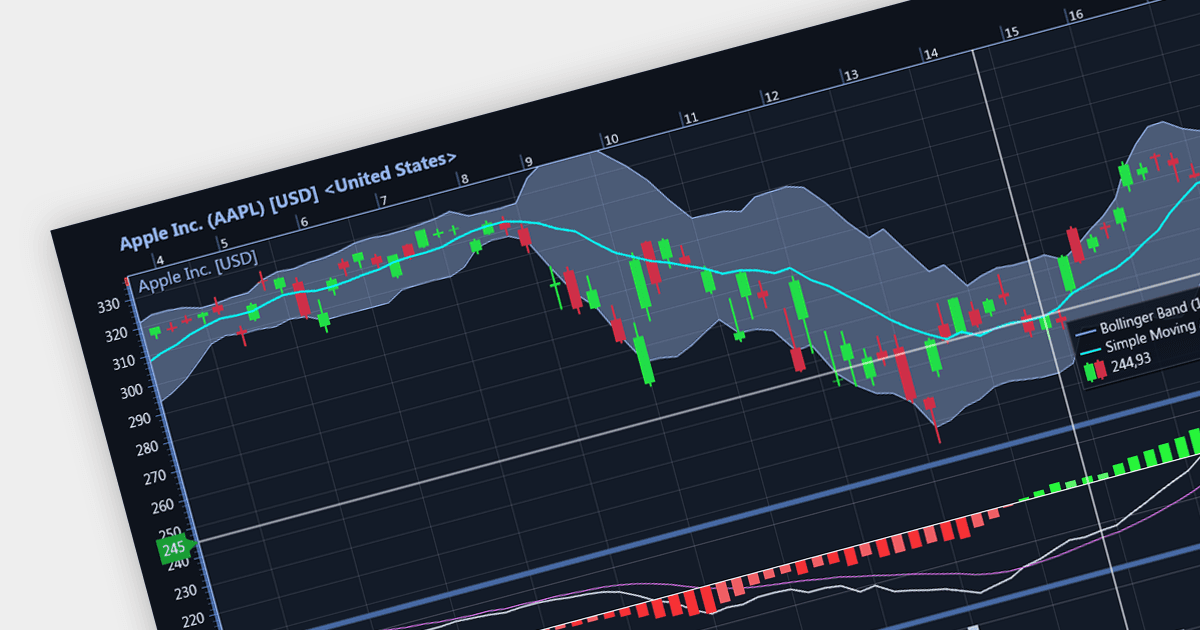
Os gráficos de candles (candlestick) são um tipo de gráfico financeiro usado para descrever as variações de preço de um ativo, derivativo ou moeda. Cada "candlestick" normalmente mostra um dia, com a "caixa" central representando a faixa entre os preços de abertura e fechamento, e as linhas exibindo as máximas e mínimas. O formato visual exclusivo ajuda os traders a entenderem rapidamente o sentimento do mercado.
Diversos controles de gráfico WinForms oferecem gráficos de Candlestick, incluindo:
- DevExpress WinForms Chart (parte do DevExpress WinForms) oferece controle preciso sobre cada aspecto dos candles, das sombras aos pavios (wicks), ideal para análise técnica.
- ComponentOne Charts for WinForms (parte do ComponentOne Studio WinForms) inclui modelos de candlestick prontos e indicadores financeiros que aceleram a análise do mercado.
- Telerik Windows Forms ChartView (parte do Telerik UI for WinForms) oferece renderização de candlestick simplificada com zoom/pan suave, ideal para plataformas de negociação dinâmicas.
- Syncfusion WinForms Chart (parte do Syncfusion Essential Studio Enterprise) oferece amplas opções de personalização que permitem adaptar os candles às suas necessidades de negociação.
- LightningChart .NET fornece atualizações rápidas de candlestick que ajudam você a ficar à frente do mercado, perfeito para dashboards de negociação em tempo real.
Para uma análise aprofundada de recursos e preço, visite nossa comparação de controles de gráfico WinForms.