


Fornecedor oficial
Como distribuidores oficiais e autorizados, nós fornecemos licenças legítimas diretamente de mais de 200 editores de software.
Ver todas as nossas marcas.
Continuar leitura em inglês:
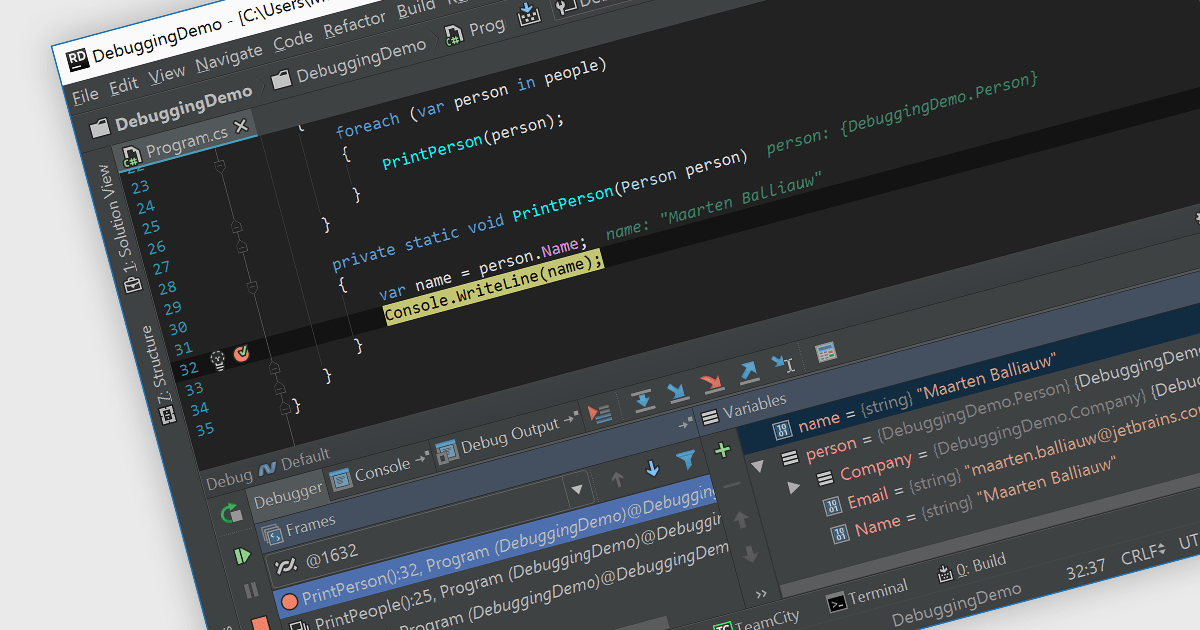
Debugging is the methodical process of identifying and rectifying errors or bugs within code. Many Integrated Development Environments (IDEs) provide a platform for debugging by allowing programmers to step through code execution line by line, examine variable values at specific points, and set breakpoints to pause execution at designated sections. This controlled environment empowers developers to easily pinpoint the cause of issues and implement fixes.
Several IDEs provide debugging including:
For an in-depth analysis of features and price, visit our IDEs comparison.
Tel: (888) 850 9911
Fax: +1 770 250 6199


