Revele Correlações com Pontos de Dados Visuais
Explore visualmente relações, outliers e intervalos de dados com gráficos de dispersão intuitivos, permitindo uma compreensão clara e uma análise informada.
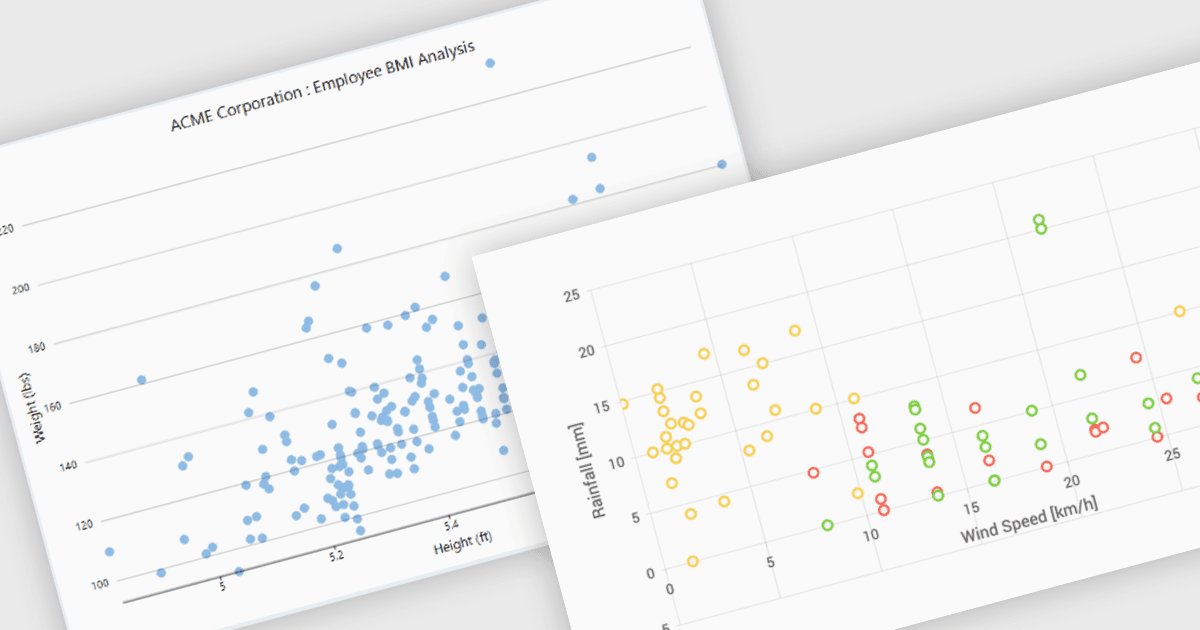
Gráficos de dispersão, também conhecidos como scatter plots ou scatter diagrams, são ferramentas fundamentais de visualização usadas para explorar a relação entre duas variáveis contínuas, plotando pontos de dados em que a posição de cada ponto é determinada pelos valores correspondentes das duas variáveis. Essa representação visual revela efetivamente correlações e ajuda a identificar outliers, agrupamentos (clusters) e o intervalo geral e a distribuição dos dados. Os benefícios de usar gráficos de dispersão incluem sua simplicidade para comunicar relações complexas, sua capacidade de destacar anomalias que poderiam ser perdidas em dados tabulares e seu papel como etapa anterior a análises estatísticas mais avançadas, como regressão.
Vários controles de gráficos .NET WinForms oferecem gráficos de dispersão, incluindo:
- DevExpress WinForms Chart (parte do DevExpress WinForms) facilita a análise perspicaz de dados ao visualizar correlações e distribuições por meio de scatter plots interativos com opções ricas de estilo.
- TeeChart WinForms da Steema Software permite que os desenvolvedores criem séries de dispersão diversas com personalização de pontos, análise de linha de tendência e zoom para uma exploração detalhada dos dados.
- Syncfusion WinForms Chart (parte do Syncfusion Essential Studio Enterprise) permite criar gráficos de dispersão visualmente atraentes com recursos como rótulos de dados, tooltips e várias séries para análise comparativa de relacionamentos.
- ProEssentials da GigaSoft fornece gráficos de dispersão de alto desempenho para revelar tendências, clusters e outliers para uma exploração de dados rápida, em tempo real e interativa, além de análises informadas.
Para uma análise aprofundada de recursos e preço, acesse nossa comparação de controles de gráficos .NET WinForms.