Visualize tendências ao longo do tempo com gráficos de linhas
Os gráficos de linhas oferecem uma visão da evolução de métricas, permitindo comparações entre várias séries, identificação de mudanças e previsão estratégica.
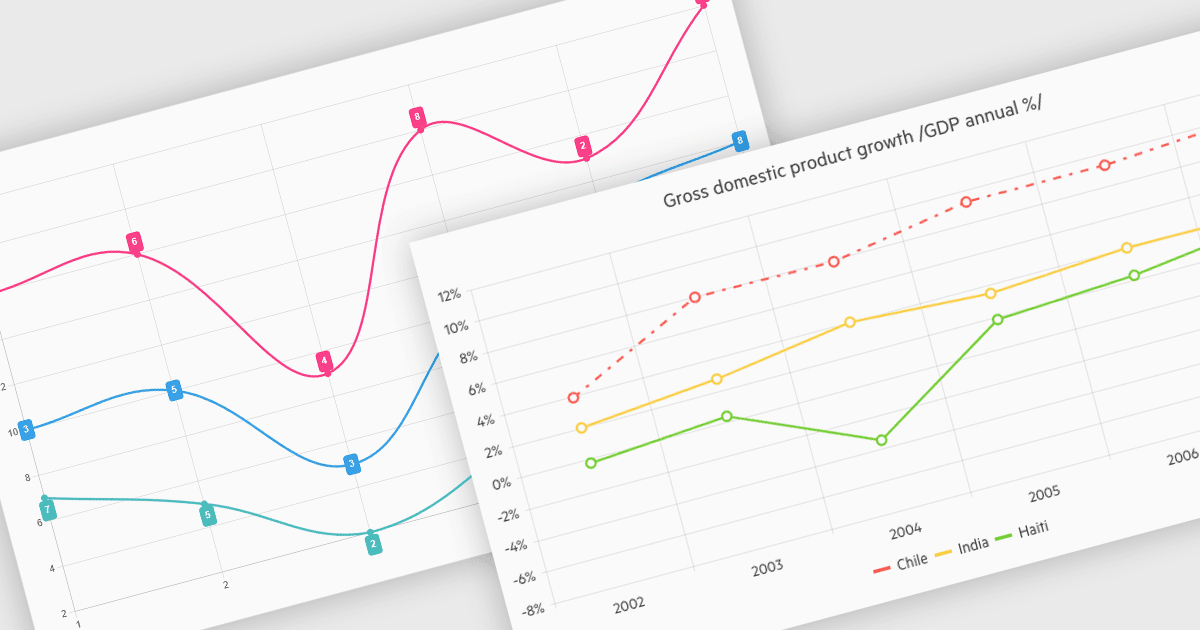
Os gráficos de linhas conectam pontos de dados com linhas para mostrar como os valores mudam em uma escala contínua, geralmente o tempo. Eles facilitam a visualização de tendências de longo prazo, padrões sazonais e mudanças súbitas ao comparar várias séries nos mesmos eixos. Aplicações comuns incluem acompanhar preços de ações, monitorar o tráfego do site, analisar dados climáticos e comparar vendas regionais para orientar a estratégia de negócios. Ao destacar a progressão e anomalias sem poluição visual, os gráficos de linhas ajudam a transformar números brutos em insights claros e acionáveis.
Diversos Controles de Gráfico .NET Blazor oferecem suporte a gráficos de linhas, incluindo:
- Blazorise Chart permite criar gráficos de linhas personalizáveis com animações suaves, tooltips, zoom e layouts responsivos para aplicativos em tempo real de alto desempenho.
- TeeChart Blazor da Steema Software possibilita renderizar gráficos de linhas de alto desempenho com várias séries, estilos, recursos interativos de rolagem (panning) e controles de zoom, além de funcionalidade de exportação.
- Infragistics Blazor Charts (parte do Infragistics Ignite UI) facilita a criação responsiva de gráficos de linhas com estilos, personalização de eixos, atualizações em tempo real, marcadores de dados e tooltips.
- DevExpress Blazor Chart (parte do DevExpress ASP.NET e Blazor) permite que os desenvolvedores criem gráficos de linhas interativos com zoom e >legendas personalizáveis.
Para uma análise aprofundada de recursos e preço, visite nossa comparação de Controles de Gráfico .NET Blazor.