Ilustre Tendências do Mercado com Precisão Visual
Controles de gráficos em JavaScript com gráficos Kagi reduzem o ruído, destacam rompimentos e revelam tendências de oferta e demanda na dinâmica do mercado.
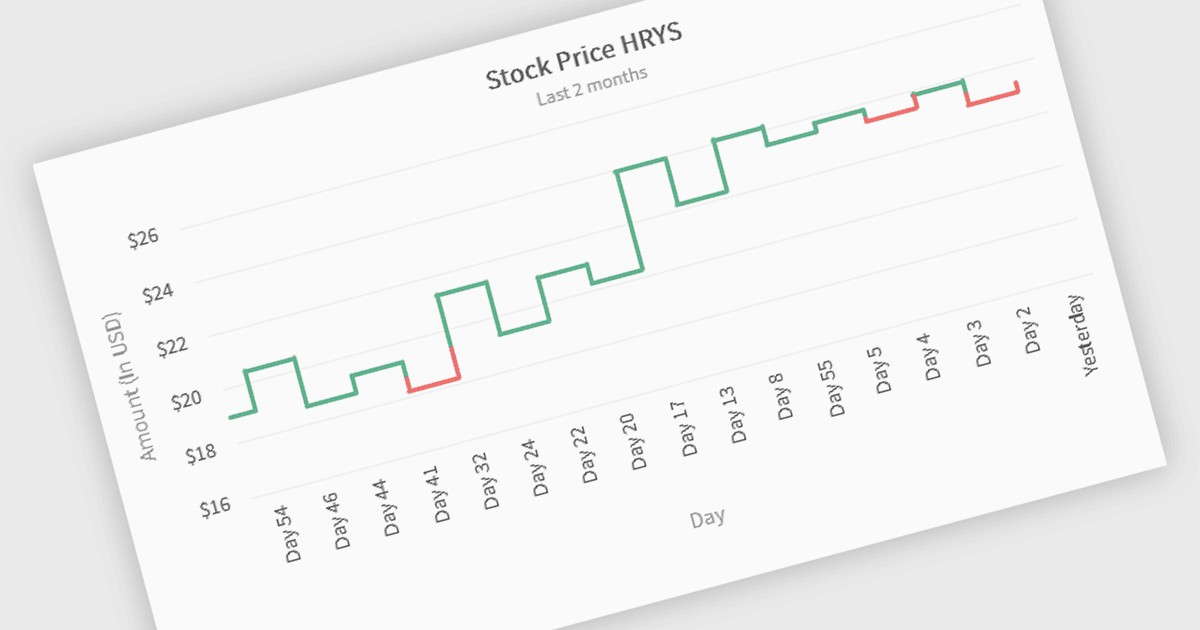
Os gráficos Kagi são uma ferramenta de análise técnica que exibe a movimentação de preços por meio de linhas verticais, ignorando o tempo para focar nas mudanças de preço mais significativas. Linhas grossas indicam aumento da demanda quando os preços rompem as máximas anteriores, enquanto linhas finas sinalizam maior oferta quando os preços caem abaixo das mínimas anteriores. Esse formato visual claro ajuda os traders a filtrar ruídos, identificar tendências e encontrar rompimentos ou reversões importantes. Ideal para analisar o sentimento do mercado, os gráficos Kagi são usados em ações, forex e commodities para apoiar decisões de trading confiáveis e orientadas por dados.
Vários componentes de gráficos em JavaScript oferecem gráficos Kagi, incluindo:
- Wijmo FlexChart (parte do Wijmo da MESCIUS) permite que você interprete a dinâmica de preços usando gráficos Kagi, filtrando ruídos para revelar sinais de trading e sentimentos mais claros.
- FusionCharts Suite XT possibilita a renderização de gráficos Kagi para destacar rompimentos de preço e reversões, aumentando a clareza nas visualizações de mercado baseadas em tendências.
- LightningChart JS Trader permite visualizar mudanças na oferta e na demanda com gráficos Kagi para análises financeiras em tempo real de alto desempenho.
Para uma análise aprofundada de recursos e preços, visite nossa comparação de gráficos em JavaScript.