Resuma Grandes Conjuntos de Dados com Tabelas Dinâmicas
Descubra padrões com tabelas dinâmicas em planilhas, permitindo uma análise interativa que revela tendências e desempenho de todos os ângulos.
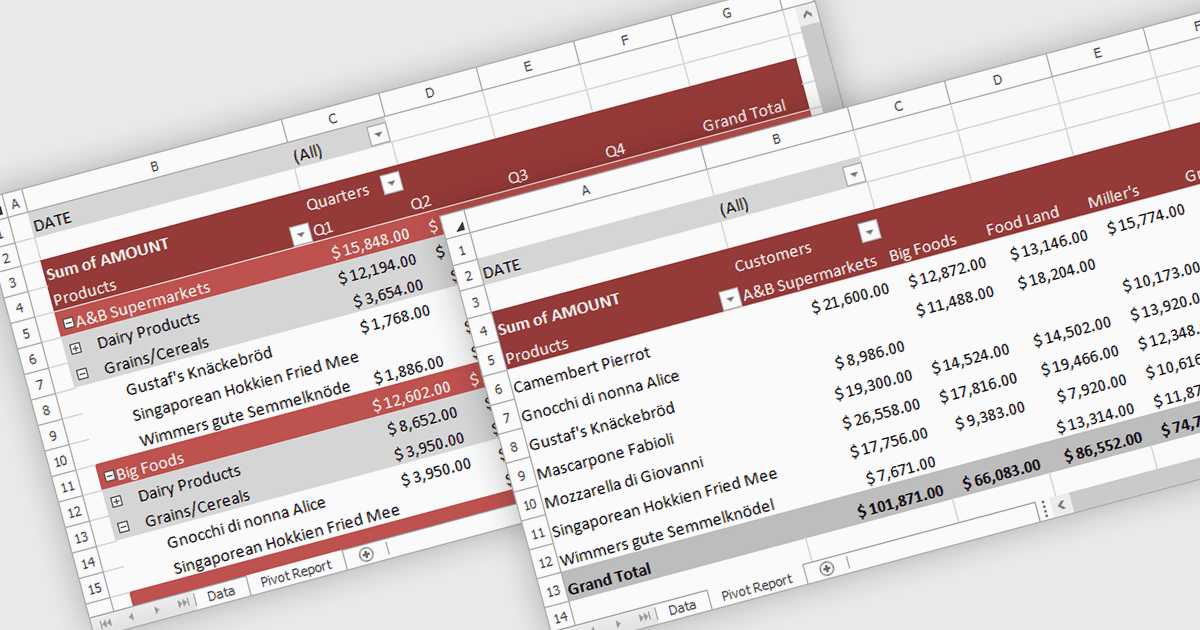
Uma tabela dinâmica em uma planilha permite que você resuma e explore rapidamente grandes conjuntos de dados, agrupando, filtrando e agregando dados de forma dinâmica. Ela calcula automaticamente totais, médias, contagens e outras métricas, reduzindo a necessidade de fórmulas complexas. Isso facilita descobrir tendências, padrões e outliers, como comparar vendas por região e produto, analisar custos por departamento ou acompanhar o desempenho ao longo do tempo. Ao transformar dados brutos em resumos claros e interativos, as tabelas dinâmicas ajudam os usuários a tomar decisões mais rápidas e informadas.
Diversos controles de planilhas para .NET Core oferecem suporte a tabelas dinâmicas, incluindo:
- DevExpress WinForms Spreadsheet (parte do DevExpress WinForms) permite que você crie tabelas dinâmicas que resumem, filtram e analisam grandes conjuntos de dados com uma exploração de dados esclarecedora.
- Document Solutions for Excel, .NET Edition da MESCIUS possibilita a criação avançada de tabelas dinâmicas para resumir dados com rapidez e realizar análises multidimensionais.
- EPPlus da EPPlus Software permite que você crie poderosas tabelas dinâmicas programaticamente, possibilitando agrupamento flexível, agregação de dados e relatórios personalizáveis em arquivos do Excel.
- IronXL for .NET da Iron Software facilita a geração de tabelas dinâmicas no código, ajudando você a transformar dados brutos de planilhas em resumos claros, comparações e insights.
Para uma análise aprofundada de recursos e preço, visite nossa comparação de controles de planilhas para .NET Core.