Simplifique Visualizações de Grandes Dados
Combine automaticamente pontos de dados para manter seus gráficos claros, responsivos e fáceis de interpretar à medida que seus conjuntos de dados crescem.
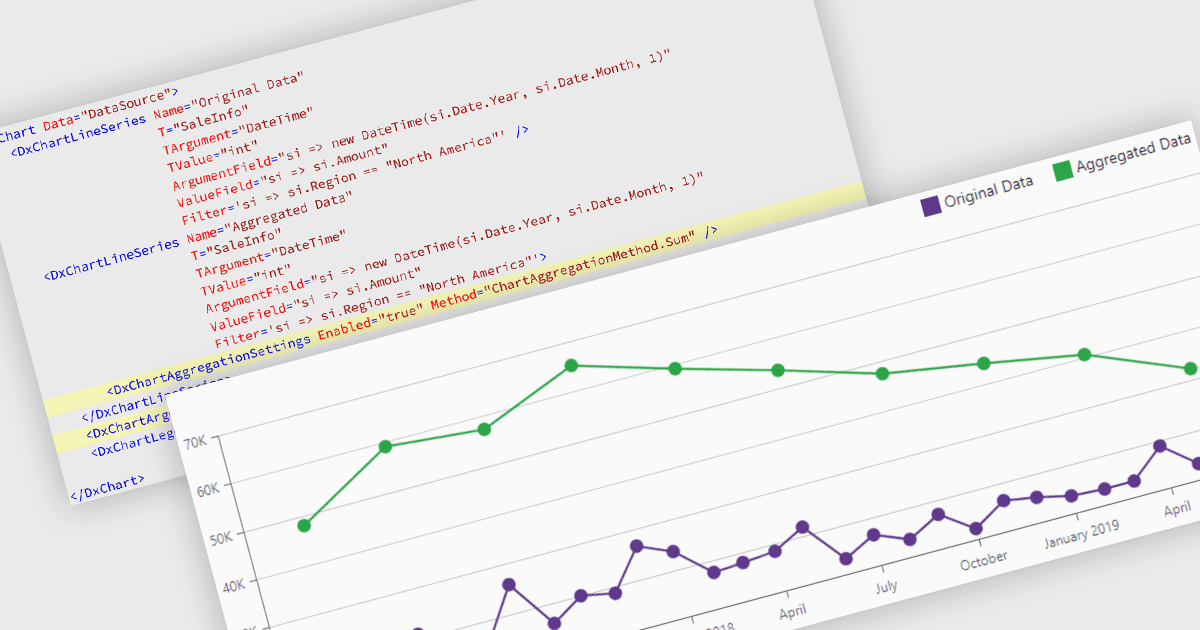
A agregação de dados nos componentes de gráficos melhora a legibilidade e o desempenho das visualizações ao combinar vários pontos de dados em grupos maiores e significativos. Isso permite que aplicativos apresentem conjuntos de dados grandes ou de alta frequência de forma mais eficaz, reduzindo a desordem visual enquanto preserva as tendências e padrões gerais. A agregação pode ser aplicada dinamicamente com base no intervalo exibido ou no intervalo selecionado, permitindo que os usuários explorem os dados em diferentes níveis de detalhe sem comprometer a responsividade.
Diversos controles de gráficos Blazor suportam agregação de dados, incluindo:
- DevExpress Blazor Charts oferecem agregação automática de dados que agrupa pontos conforme o nível de zoom atual ou intervalo visível, ajudando os gráficos a permanecerem responsivos e fáceis de interpretar ao trabalhar com grandes conjuntos de dados.
- FusionCharts Suite XT suporta agregação de dados através de suas capacidades de séries temporais, consolidando automaticamente valores em intervalos configuráveis, como minutos, horas, dias ou meses, permitindo visualizações claras em diferentes spans de tempo.
- .netCHARTING inclui opções extensas de agregação que permitem aos desenvolvedores combinar dados usando cálculos como somas, médias, mínimos, máximos e fórmulas personalizadas, tornando-o adequado para cenários analíticos e de relatório.
- NOV Chart for .NET da Nevron oferece agregação de dados embutida para grandes conjuntos, agrupando valores em intervalos configuráveis para melhorar o desempenho de renderização, mantendo uma representação precisa das tendências gerais.
Para uma análise detalhada de recursos e preços, visite nossa comparação de controles de gráficos Blazor.