Vizuly Radar Chart

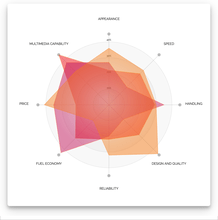
Vizuly Radar Chart graphs multiple dimensions of one datum along multiple radial axis. Each plot represents 3 or more data points along shared axis lines. This chart supports highlighting of both individual data points and the group as a whole.

Features

  • Supports Vertex Point and Group Highlighting
  • Angular or Curve Line Types
  • 6 example themes
  • More than a dozen dynamic styles
  • Dozens of adjustable properties and interactive event support
  • Customizable Data Tips
  • Documentation

Framework Adapters

  • React Adapters
  • Angular Adapters
  • Vue.js Adapters

Últimas Notícias

Lançamento do Vizuly Radar Chart
June 7, 2019Novo produto
Adicione gráficos de Radar aos seus aplicativos JavaScript.

Preços a partir de: $ 57.82

Vizuly Developer Licensing: Developer License allows a single developer to use the Software on an unlimited number of websites, intranets, web applications and SaaS projects, Developer License allows...

Vizuly Radar Chart também está disponível em:

Tem alguma pergunta?

Chat ao vivo com nossos especialistas de licenciamento de Vizuly.

Vizuly
Como distribuidores oficiais e autorizados, a ComponentSource fornece a você licenças legítimas diretamente de Vizuly.
Tipo de componente
  • JavaScript
  • Reagir
  • Angular
  • Vue. js