
Vizuly Radial Progress
Mostre valores numéricos dentro de um intervalo mínimo e máximo.
Vizuly Professional includes all Vizuly components at a significant discount.
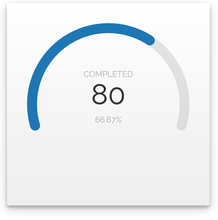
Vizuly Radial Progress is designed to show numeric values within a minimum and maximum range. It can also show when a value has exceeded the maximum threshold. This chart supports a variable range of start/stop angles, arc end caps, and comes bundled with different customizable themes.


Imagem 1 / 6
Features
Framework Adapters
Chat ao vivo com nossos especialistas de licenciamento de Vizuly.
Tel: (888) 850 9911
Fax: +1 770 250 6199


