
Vizuly Ring Chart
Exiba facilmente informações de séries temporais multivariadas.
Vizuly Professional includes all Vizuly components at a significant discount.
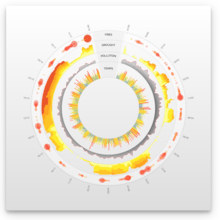
Vizuly Ring Chart lets you easily display multi-variate time series information. Due to its radial form factor, you can display 3 times the information for a given screen width than you could with a more traditional cartesian layout. You can plot one or more series using either a bar (stacked), line/area, or scatter layout. Each series can be uniquely styled and customized. In addition, the Ring Chart provides over 4 dozen customizable styles and a universal interaction model which shows the user the exact date and highlight for a given mouse position. Use the interactive style explorer on the left to view different style settings, themes, and other customizable properties.


Imagem 1 / 5
Features
Framework Adapters
Vizuly Ring Chart também está disponível em:
Chat ao vivo com nossos especialistas de licenciamento de Vizuly.
Tel: (888) 850 9911
Fax: +1 770 250 6199


