Vizuly Scatter Plot

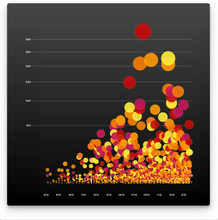
Vizuly Scatter Plot shows 3 dimensions of data at once by plotting values along both the x and y axis as well as the radius of the plot itself. Each plot can be colored and styled dynamically based on your data.

Features

  • Supports Dynamic Scales for Radius and Plots
  • 5 example themes
  • More than a dozen dynamic styles
  • Dozens of adjustable properties and interactive event support
  • Customizable Data Tips
  • Documentation

Framework Adapters

  • React Adapters
  • Angular Adapters
  • Vue.js Adapters

Últimas Notícias

Lançamento do Vizuly Scatter Plot
June 7, 2019Novo produto
Adicione gráficos de dispersão aos seus aplicativos JavaScript.

Preços a partir de: $ 57.82

Vizuly Developer Licensing: Developer License allows a single developer to use the Software on an unlimited number of websites, intranets, web applications and SaaS projects, Developer License allows...

Vizuly Scatter Plot também está disponível em:

Tem alguma pergunta?

Chat ao vivo com nossos especialistas de licenciamento de Vizuly.

Vizuly
Como distribuidores oficiais e autorizados, a ComponentSource fornece a você licenças legítimas diretamente de Vizuly.
Tipo de componente
  • JavaScript
  • Reagir
  • Angular
  • Vue. js