Fornecedor oficial
Como distribuidores oficiais e autorizados, nós fornecemos licenças legítimas diretamente de mais de 200 editores de software.
Ver todas as nossas marcas.

Descrição: Create great looking Graphs and Charts in Java. Big Faceless Graph Library allows you to create industry leading Graphs and Charts in Java. Backed by a full 3D engine, the Graph Library can plot 2D ... or shaded 3D Pie Charts, Line Graphs, Area and Bar Graphs from any viewpoint to PNG, Flash, PDF or SVG, quickly and with stunning results. Big Faceless Graph Library Features include: XML and JSP Tag Library ... . Create funnel charts. Add text, lines or custom markers anywhere on the graph, including axes. Use up to four axes on the one graph, including logarithmic axes. Plot mathematical functions, data samples ...
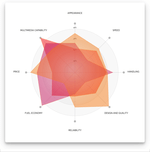
Descrição: Add Radar charts to your JavaScript apps. Vizuly Radar Chart graphs multiple dimensions of one datum along multiple radial axis. Each plot represents 3 or more data points along shared axis lines. ... This chart supports highlighting of both individual data points and the group as a whole. Features Supports Vertex Point and Group Highlighting Angular or Curve Line Types 6 example themes More than a dozen ...
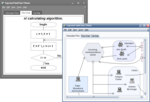
Descrição: Add flowchart functionality to your Delphi and C++Builder applications. ExpressFlowChart is a native VCL component designed to help you present charts, schemes, hierarchies, and graphs of any ... complexity with minimal coding and programming effort. With ExpressFlowChart Suite you can create information flow-workflow diagrams, hierarchical charts and displays, network layouts, and even your favorite ... city map.ExpressFlowChart Suite Includes a built-in Runtime Chart Editor, full drag-and-drop support, and more. ...
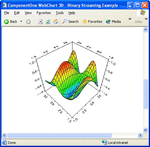
Descrição: Create browser-independent, dynamic charts for Active Server Pages (ASP). ComponentOne WebChart is an enterprise charting tool that allows you to develop charts or graphs and serve them as JPEG ... one for 2D and one for 3D. The ASP web server performs the chart creation and sends the completed charts and graphs to the browser. ComponentOne WebChart is part of the ComponentOne Studio Enterprise ... or PNG files to any browser. You can also serve the charts as an ActiveX control to allow your end-users to change chart types and data values. True WebChart features two server-side charting components- ...

Descrição: offers hundreds of chart and graph styles in 2D and 3D for data visualization, 56 mathematical, statistical and financial functions plus an unlimited number of axes and 30 Palette components. TeeGrid ... Charting and grid components for RAD Studio. TeeSuite includes a professional charting component, and an easy-to-use data grid for RAD Studio developers. TeeChart Pro charting component library ...

Descrição: Group Headers Fast, Interactive Blazor WebAssembly Charts and Graphs- Build expressive dashboards for deep analytics, and render millions of data points in real time, with more than 65 high performance ... Blazor charts and graphs. Optimized for both Blazor WebAssembly and Blazor Server, it includes stock charts, line charts, and bar charts. Ignite UI for Blazor fulfills your fintech and business needs ... for high-performance Blazor components and features for Blazor charts. All the Features You Need- Just Like Excel Charts- Choose from over 65 chart types to graph your data, including bar chart, line chart, column ...

Descrição: and more. Responsive across devices Default responsiveness goes beyond fitting the chart to the dimensions of its container but automatically finds an optimal placement for non-graph elements such as legends ... Bubble series Bullet chart Column chart Column pyramid Dependency wheel Dumbbell chart Error bar series Funnel series Heatmap Histogram Item chart Line chart Lollipop chart Network graph Organization chart ... Packed bubble Parallel coordinates Pareto chart Pie chart Polar (Radar) chart Radial (or Circular) bar chart Range series Sankey diagram Scatter chart Spline chart Stream graph Sunburst Timeline chart ...
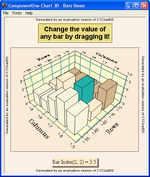
Descrição: high-performance 2D and 3D charts and graphs. Now with 2D and 3D Unicode controls for National Language Support. ComponentOne Chart ActiveX offers now 64bit (x64) support Optimized for performance, ComponentOne ... Create and customize virtually any type of chart. ComponentOne Chart provides hundreds of properties and methods to create an unlimited variety of charts with variations of color, style annotations, ... and perspectives, including: Bar, Pie, Area, Line, Polar, Ribbon, Bubble, 3D Scatter, and many more. ComponentOne Chart supports data binding to any data source, allows you to use bitmap or metafiles as background ...

Descrição: decisions. Solve real world problems, identify bottlenecks, enhance resource allocation, improve scheduling and improve business outcomes before committing funds to a project. Charts and Graphs Enterprise ... Architect uses charts and graphs to help visualize the results of various simulations. Report data can become input for a chart element. Compare and contrast the results from a base simulation and subsequent ... experiments. Stakeholders can easily draw conclusions from the corresponding charts. Visualize data from multiple report sources and customize the appearance to meet your individual needs. Charts and graphs help ...

Descrição: The chart library provides full support for TypeScript if you prefer to use it instead of JavaScript. The download archive includes a Charting.d.ts file, which contains TypeScript definitions of the ... Gráficos, medidores e painéis interativos escritos em puro JavaScript. MindFusion.Charting for JavaScript combines 2D and 3D charts, financial graphs, gauges and dashboards. It includes an elegant ... API, a rich event set, unlimited number and type of data series and everything else you might need to create the perfect data visualization in JavaScript and HTML. MindFusion.Charting for JavaScript ...

Descrição: customizable items, and more. Charts- A wide range of charts, graph types and series that enable you to visualize data according to the native platform standards of Android, iOS, macOS, and Windows. DataGrid- ... including some of the most requested ones across the Telerik portfolio such as.NET MAUI ListView, DataGrid, Charts, DatePicker, TabView, Editors and others. Desktop support is offered for all controls, a new ... ListView ItemsControl DataGrid DataForm Data Visualization Rating Map Gauge Barcode Charts Spline Chart Spline Area Chart Scatter Spline Chart Scatter Spline Area Chart Scatter Point Chart Scatter Line Chart ...
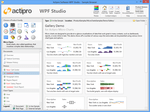
Descrição: customizable palettes, and data aggregation. Other included controls are box plots, bullet graphs, candlestick charts, heat maps, segment charts, and trend indicators. Actipro Micro Charts Features Line Charts ... Small charts and sparklines designed to visualize complex data. Actipro Micro Charts for WPF is a set of charts that visualize quantitative data and are designed to render clearly in compact spaces. ... Many chart types are supported, from basic line and bar charts to stacked area charts. The sparkline chart controls include numerous useful features such as multiple series, stacking, hot tracking, ...

Descrição: includes a vast number of chart and graph kinds, as well as series, that allow you to view data using native Desktop, iOS, and Android standards. Different chart and graph formats, such as Line, Area, ... app with Telerik Document Processing Libraries developed for.NET Standard, without the need for Microsoft Office Interop. Most Popular Xamarin UI Components: Chart- Telerik UI for Xamarin Charts ... and Spline Area, can be used to compare sets of data using horizontal or vertical Bar Charts, and/or to depict proportions using Pie Charts or Donut Charts. DataGrid- The Telerik UI for Xamarin DataGrid ...
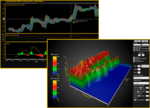
Descrição: High-performance Charts and Graphs for WPF, WinForms and UWP. LightningChart.NET is a high performing charting library for desktop application development, fully GPU-accelerated with a rendering ... to be the fastest charting library in the world for desktop and web." says Pasi Tuomainen, LightningChart CEO. As ultra-high performant.NET charts for WPF, WinForms and UWP, LightningChart.NET is meant ... a higher FPS and a significantly better responsiveness to user interactions. Why LightningChart.NET? High Performance Entirely GPU accelerated chart control with a full optimization towards performance ...

Descrição: Modern charts made easy for C# and VB.NET applications. BuniCharts is a well-crafted chart component to visualize your application data. It contains a rich gallery of charts and graphs and its high ... designers and developers to draw all kinds of charts on their WinForms application. It offers a great array of simple, clean charts with interactivity powered by chart animations. BuniCharts provides an easy ... way to plot beautiful data visualizations in your.NET project. Packaged as a DLL it includes drag and drop chart components that plot on a chart canvas. Each chart component is loaded with unique chart ...

Descrição: Interactive charts, gauges and dashboards written in pure JavaScript. MindFusion.Charting for JavaScript combines 2D and 3D charts, financial graphs, gauges and dashboards. It includes an elegant ... API, a rich event set, unlimited number and type of data series and everything else you might need to create the perfect data visualization in JavaScript and HTML. MindFusion.Charting for JavaScript ... Features Support for All Common Chart Types- The JavaScript chart supports all popular chart types and their variations: pie, doughnut, bar, column, radar, polar, line, area, scatter, bubble, step charts ...
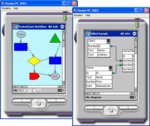
Descrição: and relationship charts and graphs. Its basic types of objects- boxes, tables, and arrows- can be grouped or attached one to another and combined in complex structures. The control provides more than 70 predefined ... With PocketChart you provide your application with a rich visualization tool, suitable for graphical illustration of: Workflow processes Object hierarchies and relationships Graphs and networks Entity-relationship ... (ER) / database diagrams IVR systems Industrial automation plans Genealogy trees Algorithms and flowcharts Organizational charts XML documents Classification hierarchies The software has been tested ...
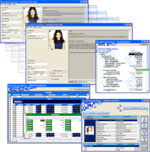
Descrição: are all available with 64-bit support. Chart Controls Create sophisticated charts and graphs with fast, real-time tracking and flexible data binding, and serve your charts as JPEG or PNG images. Easy-to-use ... charts or graphs and serve them as JPEG or PNG files to any browser. You can also serve the charts as an ActiveX control to allow your end-users to change chart types and data values. True WebChart ... features two server-side charting components- one for 2D and one for 3D. The ASP web server performs the chart creation and sends the completed charts and graphs to the browser. VSFlexGrid Pro (available ...
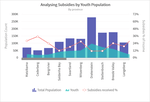
Descrição: Stacked Area Real-time Stacked Column Real-time Line (Dual Y) Spark Charts Spark Line Spark Column Spark Win/Loss Bullet Graphs Horizontal bullet graph Vertical bullet graph Other Charts Funnel Chart ... JavaScript (HTML5) charts and gauges that work across multiple devices and platforms. FusionCharts Suite XT helps you build beautiful dashboards for your Web and mobile projects. With extensive ... documentation, cross-browser support, and a consistent API, it is easier than ever to add interactive and responsive charts. From simple charts like line, column, and pie to domain-specific charts like heatmaps, ...
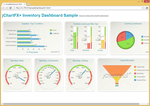
Descrição: Develop full, commercial dashboards and business intelligence applications. jChartFX Plus includes a complete collection of charts and graphs for professional data visualization. It also comes ... or no dependencies to generate a wide array of charts for your browser based applications. jChartFX Plus Features Adaptive- jChartFX Plus reads and interprets jQuery themes and CSS files to quickly adapt to your page ... jChartFX Plus lets you customize virtually any chart element. Browsers- jChartFX Plus is a browser-based charting engine that takes advantage of the HTML 5 standard to render locally without any server side ...