Fornecedor oficial
Como distribuidores oficiais e autorizados, nós fornecemos licenças legítimas diretamente de mais de 200 editores de software.
Ver todas as nossas marcas.

Descrição: JavaScript (HTML5) enterprise-grade charts and graphs for dynamic web applications. FusionCharts XT is an industry leading JavaScript charting component. Leveraging the power of JavaScript (HTML5), ... range of chart types with smart reporting capabilities, animations and interactivity are bound to make your apps look stunning and power-packed. It works with both JSON & XML data, and can integrate ... your first chart. FusionCharts XT is the trusted charting component of over 21,000 customers, including a majority of Fortune 500 companies, and 450,000 developers in over 118 countries. Advantages ...
Notas de versão: chart. Crossline color is now properly updated on changing theme, for Stacked Column chart. The background color of the Thermometer graph is now properly updated ... Introduces two new chart types- Overlapped Column Chart and Overlapped Bar Chart. FusionCharts Suite XT v3.13.0 introduces two new chart types: overlapped column chart and overlapped bar chart ... . Spline and Spline Area charts can now be built as part of combination charts, using the `renderAs` attribute. A common theme can now be applied to all charts in a page. For dual y-axis charts ...

Descrição: just 15 minutes to create your first chart. FusionCharts XT is the trusted charting component of over 21,000 customers, including a majority of Fortune 500 companies, and 450,000 developers in over 118 ... says the web is fragmented? The industry's most comprehensive charting library with over 90 chart types Why use a column chart when a Bubble chart is what you need? Incorrect chart types lead to ... Gráficos e tabelas de nível empresarial em JavaScript (HTML5) para aplicativos dinâmicos da Web. FusionCharts XT is an industry leading JavaScript charting component. Leveraging the power of ...
Notas de versão: Updates in v3.4 Rendering supported in Javascript only, support for rendering in Flash deprecated. Significant improvement in chart rendering time. Dependency on jQuery removed leading to reduction ... in JavaScript code footprint. New developer friendly documentation introduced for the JavaScript only API. Theme manager added to allow easy application of presentation features across charts. Annotation engine ... added to allow addition of text and shapes on charts. Additional events available for deeper integration of charts with applications. Support for hover effect on all common charts. Support for macro ...
Notas de versão: attributes were added to nodes, ribbons and labels for Chord diagrams. When exporting spark charts as a CSV file or CSV data using getCSVData() or getChartData('csv') methods, the exported csv now ... charts now display sorted values in decreasing order. Using the isRaw boolean property getJSONData() and getChartData() now return property names in the same format as defined in the dataSource. Legend ... spacing is optimized to have better data ink ratio for legends in charts to avoid unexpected space between legend items. Fixes For cartesian axis charts yAxisValueDecimal now works properly when ...

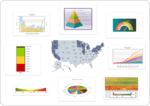
Capturas de tela: Why use a column chart when a funnel chart is what you need? Incorrect chart types lead to incorrect analysis, which in turn lead to incorrect business decisions. Your users deserve better. ... FusionCharts Suite XT brings you 90 chart types (total number for suite) right from the basic Column, Line, Pie and Speedometer charts to the more advanced Funnel, Pyramid, Pareto and Zoom Line Charts. You also ... get specialized charts for network diagrams, employee performance analysis and stock price plotting. ...
Notas de versão: FusionCharts Angular wrapper is now compatible with Angular 8. You can now render charts in angular using angular-fusioncharts wrapper. Previously, the charts were not getting rendered in angular ...
Notas de versão: Introduced a new attribute named inheritPlotBorderColor for area charts to set the border color of the plot by inheriting the plot color. You can now customize the position of the x-axis. You can ... will be visible. Chart specific attributes for this include, minHeightForValue (column or bar encodings), minRadiusForValue (bubble chart), minAngelForValue (pie or doughnut charts). You can now specify the radius ... of a pie/doughnut chart in both percentage and pixel values. In pie/doughnut 2D charts, you can now place data labels and data values inside the slices, using the new labelPosition and valuePosition attributes, ...
Notas de versão: Updates in v3.13.5 Improvement In a multi-level pie chart, 'showLabel' and 'showValue' attributes are now supported at the 'category'level. The file format to export ... a chart in Excel is now changed from '.xls' to '.xlsx'. Fixes In a multi-series chart, if a series is hidden at the time of rendering and the attribute 'transposeAxis'is set ... as '1', the y-axis was not scaling properly. This issue is now fixed. On exporting charts as PDF from a page which has multiple charts, the exported PDF was not opening properly in other applications, ...
Notas de versão: Updates in v3.13.5-sr.1 A minor bug for MSCombiDY2D and MSCombi2D has been fixed. ...

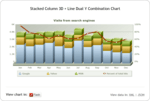
Capturas de tela: In addition to all the general purpose charts, FusionCharts XT offers advanced charts like Combination, Scroll, Zoom Line, XY Plot, Marimekko and Pareto charts. ...

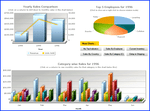
Capturas de tela: The Charts don't just look good; they feel good too! Fusioncharts are highly interactive with drill-down, tooltips, zooming, panning, chart export and visual editing. Makes for an enjoyable ...
Notas de versão: Improved memory consumption for charts that are continuously rendered and disposed. FusionCharts export servers have been reconfigured to introduce the following features: Export charts ... in auto-export mode- lets users make optimum use of the server-side and client-side export capabilities. Export statistics can now be logged to obtain details like the type of the exported chart, the format ... in which the chart was exported, and IP address of the user exporting the chart. The 'exportAction' attribute can now send the exported file as a download to the client as well as save a copy ...
Notas de versão: is used to set custom chart messages. The showChartMessage() API is now modified to: showChartMessage(text, modal, cancelable, customAttrs) Where, customAttrs is an object that can take the color, ... fontSize, and font attributes as values. Tooltips no longer overflow out of charts. Previously, in spite of enough space being available, the tooltips would flow out of charts. Now, if there is sufficient ... rendering space available, the tooltip is constrained to fit inside the chart. Trailing commas in the JS code generated by the.NET wrapper have now been removed. FusionCharts Fixes: For the zoomline dual ...
Notas de versão: Improves chart rendering performance. For scroll stacked column charts the showSum attribute now works even if the dataset value is set to `0`. Significantly improved chart rendering speed. For all ... the charts in FusionCharts Suite XT, annotations can now be displayed above all the elements in the chart if you set `showBelow=0`. In the zoom scatter chart, the regression line now works as expected. ... Previously,it was getting extended upto the width of the canvas. In the zoomline chart, Traditional tooltips are now displayed when useCrossLine=0. For 2D pie charts, labelDisplay attribute now works as expected ...
Notas de versão: Multiple charts on the same page can be exported as a single image. New animateClockwise attribute configures the direction of animation (clockwise or anticlockwise) for pie and doughnut charts. New ... alphaAnimation attribute enforces initial animation via alpha transition. New toolbar introduced to manage the UI action elements (context menus, checkboes, buttons) centrally. Chart data can now be exported ... to XLS. Batch export allows multiple charts on the same page to be exported as a single JPG/PNG image. Legend interactivity has been enabled for the Marimekko chart. 3D pie charts, interaction has been ...
Notas de versão: Updates in v3.10 New Features FusionCharts XT v3.10.0 introduces support for the zoomscatter chart and the zoomline dual yaxis chart. The zoomscatter chart is an extension of the scatter chart ... with the zooming and panning ability for large number of data points and can be used for finding correlations between data sets. The zoomline dual yaxis chart, an extension of the zoomline chart, can be used to plot ... the corresponding legend item is clicked: transposeAnimation transposeAnimDuration The following attribute has been introduced to determine the visibility of a data plot, when the chart is first loaded: visible ...
Notas de versão: Updates in 3.9 Improvements In zoomline charts, overlapping of tooltips for data plots having very close values has been fixed. Fixes JavaScript Runtime error, caused by enabling recursive number ... scaling (scaleRecursively=1) for the secondary yaxis in the dual yaxis multiseries combination chart (MSCombiDY2D), has been fixed. All line and area charts now render correctly in IE8 when the document ... mode is set to Standards and animation=1. Previously, under these conditions, the data plots in the line and area charts would disappear after the chart finished rendering. Interactive layers for line ...
Notas de versão: Updates in 3.8.0 New attributes have been added to customize the legend icon shape. New client-side export feature enables the direct export of charts from Google Chrome and Mozilla Firefox ...
Notas de versão: Updates in v3.7.1 Fixes: Latest version of Firefox (37.0.1) introduced two bugs which were fixed in this release: Data plot border in column 2D charts is now visible. Line segments in all line ... and area-based charts are now visible. ...