Fornecedor oficial
Como distribuidores oficiais e autorizados, nós fornecemos licenças legítimas diretamente de mais de 200 editores de software.
Ver todas as nossas marcas.

Descrição: like dial charts, linear gauges, LEDs, cylinder gauge, thermometers, Gantt charts, funnel & pyramid charts, bullet graphs and spark-lines. This ensures that your data always has the right face, ... iPhones and a majority of other mobile devices. With FusionWidgets XT, you get a wide variety of gauges and charts including dial charts, linear gauges, Gantt charts, funnel charts, spark-lines ... and data-streaming column, line and area charts. FusionWidgets XT works well with both XML and JSON data, and can be rendered client side, or integrated with any server-side technology (ASP.NET, PHP, Python, Java, ...
Notas de versão: Bullet graphs now support realtime data. Bullet graphs now support realtime data. New toolbar introduced to manage the UI action elements (context menus, checkboes, buttons) centrally. Chart data ... can now be exported to XLS. Batch export allows multiple charts on the same page to be exported as a single JPG/PNG image. Legend sliders are now hidden when the gradient legend is disabled in charts ... graphs. Previously, when targetThickness > 2, the target element appears distorted around the edges. targetCapStyle fixes this bug. Data values for multiple dials and pointers can now be separated using ...

Descrição: users a complete reporting experience: FusionWidgets XT comes packed with smart reporting capabilities like real-time charting, tooltips and interactive legends that give your users a complete reporting ...
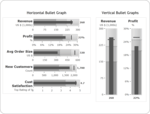
Capturas de tela: A bullet graph is a variation of a bar graph that serves as a replacement for dashboard gauges and meters. Bullet graphs overcome the fundamental issues of gauges and meters which typically require ... too much space and are cluttered with distracting decoration. The bullet graph features a single, primary measure (for example, current year-to-date revenue), compares that measure to one or more other ...
Notas de versão: Updates in v3.4 Rendering supported in Javascript only, support for rendering in Flash deprecated. Significant improvement in chart rendering time. Dependency on jQuery removed leading to reduction ... in JavaScript code footprint. New developer friendly documentation introduced for the JavaScript only API. Theme manager added to allow easy application of presentation features across charts. Annotation engine ... added to allow addition of text and shapes on charts. Additional events available for deeper integration of charts with applications. Support for hover effect on all common charts. Support for macro ...
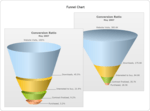
Capturas de tela: Funnel charts are basically use to plot streamlined data, e.g. plotting sales data for sales pipeline analysis. A funnel chart consists of various segments, each representing a data set. ...
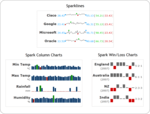
Capturas de tela: Sparks charts are "data-intense, design-simple, word-sized graphics" charts for embedding in a context of words, numbers, and images. Whereas the typical chart is designed to show as much ... data as possible, and is set off from the flow of text, spark charts are intended to be succinct, memorable, and located where they are discussed. Their use inline usually means that they are about ... the same height as the surrounding text. Also, spark charts can be intensively used in space-efficient executive dashboards to show a lot of KPIs (Key Performance Indicators) in a single view. ...
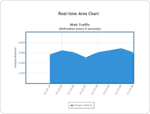
Capturas de tela: Real-time charts (also called data streaming charts) automatically update themselves every 'n' seconds by getting new data from the server. You can use them to display up-to-second data ...
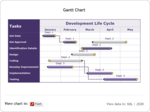
Capturas de tela: The Gantt chart is a specialized chart used for displaying various timelines like project timelines, development timelines etc. It can be used for any of the following; planning and scheduling ... projects, assessing how long a project should take, laying out the order in which tasks need to be carried out, managing dependencies between tasks and determining the resources needed. In short, Gantt charts ...
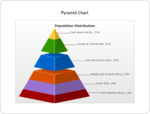
Capturas de tela: Pyramid charts are used in comparison of data, e.g. sales data of a product for a year. A pyramid chart consists of various segments, each representing a data set. The height of the pyramid segment ...
Notas de versão: Updates in v3.7.1 Fixes: Latest version of Firefox (37.0.1) introduced two bugs which were fixed in this release: Data plot border in column 2D charts is now visible. Line segments in all line ... and area-based charts are now visible. ...
Notas de versão: Updates in v3.7 Chart loading messages can now include images, instead of just plain text. Peak data can be selectively shown on the first render of a zoom-line chart. Improved text rendering ...
Notas de versão: FusionCharts Angular wrapper is now compatible with Angular 8. You can now render charts in angular using angular-fusioncharts wrapper. Previously, the charts were not getting rendered in angular ...
Notas de versão: attributes were added to nodes, ribbons and labels for Chord diagrams. When exporting spark charts as a CSV file or CSV data using getCSVData() or getChartData('csv') methods, the exported csv now ... charts now display sorted values in decreasing order. Using the isRaw boolean property getJSONData() and getChartData() now return property names in the same format as defined in the dataSource. Legend ... spacing is optimized to have better data ink ratio for legends in charts to avoid unexpected space between legend items. Fixes For cartesian axis charts yAxisValueDecimal now works properly when ...
Notas de versão: Introduced a new attribute named inheritPlotBorderColor for area charts to set the border color of the plot by inheriting the plot color. You can now customize the position of the x-axis. You can ... will be visible. Chart specific attributes for this include, minHeightForValue (column or bar encodings), minRadiusForValue (bubble chart), minAngelForValue (pie or doughnut charts). You can now specify the radius ... of a pie/doughnut chart in both percentage and pixel values. In pie/doughnut 2D charts, you can now place data labels and data values inside the slices, using the new labelPosition and valuePosition attributes, ...
Notas de versão: Updates in v3.13.5 Improvement In a multi-level pie chart, 'showLabel' and 'showValue' attributes are now supported at the 'category'level. The file format to export ... a chart in Excel is now changed from '.xls' to '.xlsx'. Fixes In a multi-series chart, if a series is hidden at the time of rendering and the attribute 'transposeAxis'is set ... as '1', the y-axis was not scaling properly. This issue is now fixed. On exporting charts as PDF from a page which has multiple charts, the exported PDF was not opening properly in other applications, ...
Notas de versão: Common theme can now be applied to all charts in a page. A common theme can now be applied to all charts in a page. Custom fonts from client-side export can now be exported using `useSVGDeCanvo` ... of the 'prevented' property. `getSVGString` now accepts an object as the second parameter with a property named `keepImages`. It can now export the logo or any images (background images, etc.) present in the chart ... . `fusioncharts.vml.js` file has been added to the package for Internet Explorer which contains all the VML related codes. `render()` function will also be fired when updating the chart type. In Real-time charts, request ...
Notas de versão: on the trendline's text. Significantly improved chart rendering speed. For all the charts in FusionCharts Suite XT, annotations can now be displayed above all the elements in the chart if you set `showBelow=0`. ... For funnel and pyramid charts, the `baseFont` attribute now works as expected. For the gantt chart, showSlackAsFill attribute is now functional. In realtime charts, using updateInterval the realtime data gets rendered at expected time. For angular gauge, the value ... of the lower limit is now rectified. Previously, if the lower limit was not specified, it was inheriting the value of the dial. The issue of chart caption and subcaption overlapping the chart canvas in Google ...
Notas de versão: is used to set custom chart messages. The showChartMessage() API is now modified to: showChartMessage(text, modal, cancelable, customAttrs) Where, customAttrs is an object that can take the color, ... fontSize, and font attributes as values. Tooltips no longer overflow out of charts. Previously, in spite of enough space being available, the tooltips would flow out of charts. Now, if there is sufficient ... rendering space available, the tooltip is constrained to fit inside the chart. Trailing commas in the JS code generated by the.NET wrapper have now been removed. FusionWidgets Fixes: For all gauges, when ...
Notas de versão: Updates in 3.9 New Features The variableIndex attribute has been introduced to determine how the data index will be assigned to data plots in realtime charts. Improvements The alertObj object is now ... available as the second parameter of the alertComplete event, allowing the user more control over the event. Improved label management for funnel and pyramid charts, with a large number of data labels. ... Improvements include: Skipping of less significant labels (determined based on label position inside the unit block) Chart repositioning to display maximum label text, before label text is truncated by ellipsis ...