Fornecedor oficial
Como distribuidores oficiais e autorizados, nós fornecemos licenças legítimas diretamente de mais de 200 editores de software.
Ver todas as nossas marcas.

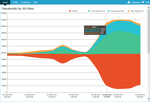
Notas de versão: Adds Stream Graphs and Stream Graph feeds. ZingChart now works with Flexbox. New selection tool. Stream Graphs. Stream Graph feeds. New event for context menu. Added jsRule on radar charts ... . Background image position has been adjusted for radial charts. Treemap has new layout options: random, squarify, squarifyV2 and balancedV2. Added a new hover layer for plot hover state. You can now have ... and marker are set to {visible: false} the legend will become invisible. Selected state now preserved on graph API interactions and resize events. Token pie-total-value works with decimals attribute. Gauge ...

Notas de versão: to different charts. Selection tool works better with more chart types and styling. Updated animations with value-box to look a lot smoother. Stream graphs now work better with feeds. 3d-facets added to the DOM ... %offset-values token for floating bars. Scale-v and scale-k tooltips added. Implemented active-area by default for radar charts. active-area triggers the hover-state when mouseover the area portion of the plot. ... Grouping of shapes to apply updates to them as a whole. Works for maps and shapes. Callback for feeds now passes back graph information so you can use a single function to return different values ...

Notas de versão: Adds new Organizational Charts. New Organizational Charts. Introduced ability to hide specific goals for bubble charts. Reduced the limits of zoom to minimum 2 scale steps and 10x10 pixels. Allow ... pagescroll mobile context menu item to be disabled. Standard behaviors can be overridden by gui settings set for each graph. Mobile touch scroll zooming will now scroll on nodes. Fixed alpha attribute for type ... edge case. Fixed Venn Diagram tooltip issues. Fixed zoom bug breaking specific charts. Organizational Chart ...

Notas de versão: Adds built-in logic for choropleth maps. Added Tree module (hierarchy trees and force directed graphs). Added BubbleLegend module. Added built-in logic for choropleth maps. Added ColorScale module. ... Added the ability to customize container for DataTable view. Fixed issue with a chart failing to load on 100% stacked areas with no data. Fixed visual issues with bullet stacked charts. Fixed visual ... issues with gauge charts. Fixed issues with DataTable view in full screen mode. Fixed associations on multiple scales sharing string values. Fixed tooltip positioning via API. Fixed minor bug related ...

Notas de versão: header-text. Selection tool no longer fires when dragging preview window. ZoomTo issues with graphs in a graphset. Dual plotted line with Line chart with aspect:'spline', a couple points and small ... Improved Bar Chart rendering speed with mode:'fast' coupled with maxTrackers:0 will increase the render time by over half. SVG scatter charts rendering speed were improved. This is the custom code ... marker styling on Range charts. New Logic for the attribute exact:true and displaying crosshair appropriately. 3D chart logic was revamped to allow annotations and cooler depth styling. Added a global ...

Notas de versão: on zoom bug. Fixed tooltip.wrap-text. Fixed disappearing pie chart on continual legend click (canvas). Fixed zoom-to-values so that on a graphset, it applies to all graphs in the graphset. Fixed API ... Use touch gestures when reading JavaScript charts on mobile devices. New Mobile Charts Plugin that allows users to interact with and use touch gestures when reading JavaScript charts on mobile ... devices. The plugin is currently supported on bar, line, area, scatter, bubble, pie, and donut charts. Enabled heat map scrolling on both x- and y-axes. Enabled styling for legend scrollbar and handle. ...

Notas de versão: Add new Media Rules for responsive charts. Media Rules allow you to create responsive charts that can be viewed across different desktop and mobile devices. Logarithmic scales are now available ... on scale X. Added zoom:false flag on zoomto API (to skip the actual zoom on chart) Added cubic bezier curves; fixed curves on VML Preview is set to live by default for the light and dark themes. Fixed styles ... array bug. Updated time-series step values for month and year. Disabled the default hover-state on pareto. Fixed graphset layout not being reset on a setdata API call. Fixed graph height when absolute ...
Notas de versão: APIs. Added "widths" attribute (array of numbers) under options object for customizing the width of each sunburst level. Shared legends now highlight related plots on all linked graphs as well. ...
Notas de versão: Added Saudi Arabia map- The interactive maps chart now supports the map for Saudi Arabia (maps-sau | sau). Added fast mode on bubble-pack plugin. Improved logic for value box positioning. Fixed ... performance issues on Firefox. Fixed bug with label rotation on radial trees. Fixed bug with chart auto-resize. Fixed bug with selection-tool not working on multi-chart graphsets. Fixed issue with data export. ...
Notas de versão: Fixed resize bug in SVG rendering mode. 0 ...
Notas de versão: Made various optimizations on range charts. Fixed bug with placement of gauge labels. 0 ...

Notas de versão: New attribute controls the alpha transparency of elements when hovering over chord chart bands. Added interactive Morocco map. Added 'hoverEffect' attribute to chord charts- This attribute ... dragging module on radar charts. Fixed issue with value box positioning on pie charts with a single plot. Fixed issues with setting detached attribute on pies via APIs. Fixed navigation issue after chart ... resize on sunburst charts. Fixed issue with showLine and topState on legend items. Fixed bug when setting minValue, maxValue on scaleK in radar charts. Fixed zoom issues on heatmap module. Fixed issue ...

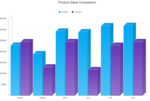
Descrição: Create animated and interactive charts with hundreds of thousands of data records. ZingChart includes over 50+ built-in chart types and modules that feature interaction with data points and zooming ... into particular segments. The ZingChart library provides you with all the tools necessary to interact with your chart data. ZingChart Features Add Interactivity to Your JavaScript Charts- ZingChart brings your ... charts to life. From interacting with data points, to zooming into a particular segment, the ZingChart library provides you with all the tools necessary to interact with your chart data. Chart Types ...

Notas de versão: with preview/zoom being out of sync on vbar charts. Fixed issues with tooltips on sunburst chart. Fixed visual artifacts on range charts. Removed legend feature from sunburst charts. Extended number of scales up ...
Notas de versão: via zingchart.plugins.tilemap[NAME] constructs. Updated node dragging plugin with logic for radar/vline/varea charts. Firing node_mouseup event when dragging ends. Fixed bug in specific scenarios when ... free form tool will not default to the lasso tool. Fixed issue with background patterns not being displayed on animated items. Fixed issue with chart export as image (in SVG render) not working ... in Safari. Fixed issue with vrange plots not working in mixed charts. Fixed issue with plotarea margins after zoom. 0 ...
Notas de versão: issue. Fixed issue with barmaxwidth attribute on multiple series. Fixed issue with color palette on sunburst charts (nodeJS version). Fixed issue with node/plot events being fired twice on mobile devices. ...
Notas de versão: Added sizefactor option on sunburst chart which controls the size factor for the entire sunburst (relative to the maximum size which is given by the plotarea boundaries). Automatically switching ... in specific instances when exact is set to true. Fixed issues occurring when chart is being resized while using zoom/scroll/preview components. Fixed multiple issues with the Heatmap plugin heatmaps are now ... being resized on chart resize heatmaps can now be included in a multigraph graphset. 0 ...
Notas de versão: Added destroy method to NodeJS build. Fixed issue with combination of highlightPlot:true and reverseSeries:true on legend. Fixed sunburst issues in NodeJS build. Fixed autofit: true on multiple scales. 0 ...

Capturas de tela: 0 ...

Capturas de tela: 0 ...