Official Supplier
As official and authorized distributors, we supply you with legitimate licenses directly from 200+ software publishers.
See all our Brands.

Description: Nevron Chart for.NET and Nevron Diagram for.NET APIs in SSRS. ... Advanced mapping and geospatial data visualization tool for Reporting Services. Nevron Map for SSRS is an advanced mapping and geospatial data visualization tool for Reporting Services. Designed ... to provide report authors with an easy and powerful way to create maps that are tightly integrated with the data. If you are looking to analyze geographic data within your reports, then Nevron Map for SSRS ...
Features: artistic/image borders. Map Code Customization Nevron Map for Reporting Services supports customization through C# code, which allows you to use the full Nevron Chart for.NET and Nevron Diagram for.NET APIs ...
Compatibility: Component Type ASP.NET WebForms 100% Managed Code Compatible Containers Visual Studio 2022 Visual Studio 2019 Visual Studio 2017 Visual Studio 2015 Visual Studio 2013 Visual Studio 2012 Visual ...
Pricing: Nevron Map for SSRS 2022.2 with Subscription 1 Developer License (Designer and Server License) with Subscription Our Part No: 552596-1130894 1 Developer License with Subscription, per Developer from ... (Minimum quantity 20) Our Part No: 552596-1130898 Nevron Map for SSRS 2022.2- Additional Report Server License Additional Report Server License Our Part No: 552596-1130893 Nevron Map for SSRS 2022.2- ...
Release Notes: Added support for Microsoft Visual Studio 2022. ...
Release Notes: Adds support for Power BI Report Server. Support for PBIRS (Microsoft Power BI Report Server)- The SSRS Vision installer can detect and register the CRI items in PBIRS (Power BI Report Server). This allows you to complement PBIRS with the powerful data visualization components in SSRS Vision. ...
Release Notes: of the examples database. Bug Fixes and Performance Improvements- the SSRS Vision features the latest charting engine of Nevron which introduces many bug fixes and performance improvements. ...
Features: Nevron Map for SSRS supports 22 map projections. Mercator Map Projection Mercator- introduced in 1569 by Gerardus Mercator. It is often described as a cylindrical projection, but it must be derived ...
Licensing: ...
Features: Nevron Map for SSRS features full control over the map parallels and meridians visibility, appearance and step. You can choose to display parallels and meridians with fine, normal or coarse density. ...
Features: Nevron Map for SSRS allows you to control the displayed geographical bounds in several ways: Fit To Bounds- the map is fitted to automatically determined bounds or custom ones. You can individually ... are bound to data. Fit to Matching Shapes- lets you fit the map to the shapes that match a specific criteria. Nevron Map for SSRS can be zoomed to a user specified zoom percent. Nevron Map for SSRS can also ...
Features: Nevron Map for SSRS supports unlimited number of map layers. Each map layer can display either a predefined or custom ESRI map. The report item comes with the following build-in maps: Map ...
Features: When making choropleth maps you are often required to fill the map using a filling rule that splits the input dataset to a user defined number of ranges. Nevron Map for SSRS supports both two color ...

Screenshots: Robinson- made in 1988 to show the entire world at once. It was specifically created in an attempt to find the good compromise to the problem of readily showing the whole globe as a flat image. The projection is neither equal-area nor conformal, abandoning both for a compromise. The creator felt ...

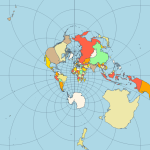
Screenshots: Stereographic- it is a particular mapping (function) that projects a sphere onto a plane. The fact that no map from the sphere to the plane can accurately represent both angles (and thus shapes) and areas is the fundamental problem of cartography. In general, area-preserving map projections are ...

Screenshots: Van der Grinten- neither equal-area nor conformal projection. It projects the entire Earth into a circle, though the polar regions are subject to extreme distortion. The projection offers pleasant balance of shape and scale distortion. Boundary is a circle; all parallels and meridians are circular ...

Screenshots: Wagner VI- a pseudocylindrical whole Earth map projection. Like the Robinson projection, it is a compromise projection, not having any special attributes other than a pleasing, low distortion appearance. ...

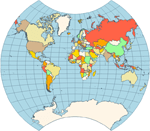
Screenshots: Winkel Tripel- a modified azimuthal map projection proposed by Oswald Winkel in 1921. The projection is the arithmetic mean of the equirectangular projection and the Aitoff projection. Goldberg & Gott show that the Winkel Tripel is arguably the best overall whole-earth map projection known, ...

Screenshots: The Mollweide projection is a pseudocylindrical map projection generally used for global maps of the world (or sky). Also known as the Babinet projection, homolographic projection, or elliptical projection. As its more explicit name Mollweide equal area projection indicates, it sacrifices fidelity ...

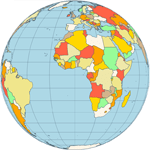
Screenshots: Orthographic- a perspective (or azimuthal) projection, in which the sphere is projected onto a tangent plane. It depicts a hemisphere of the globe as it appears from outer space. The shapes and areas are distorted, particularly near the edges, but distances are preserved along parallels. ...