Official Supplier
As official and authorized distributors, we supply you with legitimate licenses directly from 200+ software publishers.
See all our Brands.

Description: A graphical report builder for XML, XBRL, and database data. Altova StyleVision includes a drag-and-drop report design that lets you publish data in HTML, PDF, Word, and eForms simultaneously. ... & graph creation based on dynamic data. Watermark support. Barcode support. Simultaneous output in multiple formats based on a single graphical design. Support for multiple page layouts in one document. ... in Authentic eForms. HTML to XML conversion. Combining multiple sources in one design. Native support for HTML/CALS tables. Project management support. Multiple Output Formats HTML/XHTML output. RTF output. PDF ...

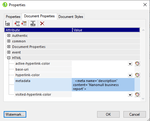
Release Notes: designers to add tags, such as meta data that is commonly included on HTML pages, to the HEAD element in HTML output. A new metadata field in the HTML section of the Document Properties dialog accepts any ...

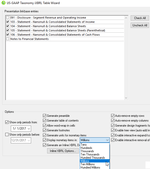
Release Notes: Adds pure text as an output format for reports from XML, database, and XBRL data, plus support for Windows 11. A new output format: pure text- For creating reports from XML, database and XBRL data ... , StyleVision now supports pure text as an output format. These text reports are ideal for machine reading or in circumstances when it’s useful to view large amounts of data without the need for styling ...

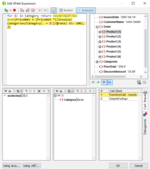
Release Notes: The new XPath dialog offers a streamlined view of data sources, XPath operators, and XPath functions for point-and-click expression building and testing. An integrated XPath Debugger makes it easy to test ...

Release Notes: in a human-readable HTML document, it’s an efficient means of decreasing the complexity of preparing and publishing financial reports while enabling the use of XBRL data by investors and other market participants. ...

Screenshots: The StyleVision design interface allows you to visually design stylesheets to render XBRL data simultaneously in online or print format(s) for presentation. 0 ...

Screenshots: Designing stylesheets in StyleVision is a highly flexible, visual drag-and-drop process. You simply select components from your data source(s), drag them onto the design pane, and specify ...

Screenshots: The StyleVision design interface allows you to visually design stylesheets to produce RTF output from XML, XBRL, or database data quickly and easily. That same design simultaneously produces ...
Release Notes: designs: 2D & 3D pie charts and bar charts, category line graphs, value line graphs and gauge charts. The Chart Configuration dialog enables users to easily select chart type, title, size, and data using ... string entries and/or XPath expressions. Chart data is selected using XPath statements. Users can input the statements directly into the dialog or they can get some assistance with XPath syntax using ... by simply dragging a financial statement or other parent node to the design pane and choosing Create XBRL Chart to start the XBRL Chart Wizard. Users can customize the data rendered in their charts ...