Official Supplier
As official and authorized distributors, we supply you with legitimate licenses directly from 200+ software publishers.
See all our Brands.

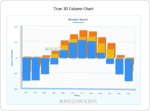
Screenshots: Need to explain detailed analysis of your data? Put all the details in tooltips. Your chart has all the info and yet it looks neat. ...

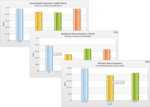
Description: and Zoom Line Charts. Rich interactivity, powerful reporting, happy users Tooltips, clickable legend keys, easy drill-down, effortless zooming and scrolling, one-click chart export and print gives your users ...

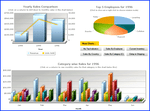
Screenshots: The Charts don't just look good; they feel good too! Fusioncharts are highly interactive with drill-down, tooltips, zooming, panning, chart export and visual editing. Makes for an enjoyable ...
Release Notes: was not working for Logarithmic charts. In Heatmap charts, the $colorRangeLabel tooltip macro was not displaying anything in the tooltips when used. The batchExport() API method was exporting a garbled image ... on Internet Explorer 11 and EDGE browsers. In candlestick charts, the tooltip was appearing even after setting the value of showTooltip attribute to 0. In bulb gauge, when the showValue attribute was modified ... in a specific order, the chart would throw a JS error when the mouse pointer hovered over the data plots. When the chart type was changed using the chartType() API method, the tooltips of the previous chart would ...
Release Notes: fontSize, and font attributes as values. Tooltips no longer overflow out of charts. Previously, in spite of enough space being available, the tooltips would flow out of charts. Now, if there is sufficient ... rendering space available, the tooltip is constrained to fit inside the chart. Trailing commas in the JS code generated by the.NET wrapper have now been removed. FusionCharts Fixes: For the zoomline dual ... y-axis chart, the traditional tooltip now includes the value of the sNumberPrefix attribute. Previously, when the numberPrefix and sNumberPrefix attributes were defined, only the value ...
Release Notes: displays column headers. Plot events and tooltips work properly with CSS 2D transformations like rotate, skew, skewX, skewY, matrix, or any combination of them. Crossline tooltips for zoomLine and zoomLineDY ... invoking the events and threw a JS error upon multiple instances of hover. When using stacked charts, the macros $sum and $unformattedSum are now working properly for customized tooltips. Previously, ... in Internet Explorer 8, as the browser does not support rounded edges of tooltip borders set using CSS. In Bubble charts, vertical lines with thickness greater than 2 are now rendered within the chart canvas. ...
Release Notes: errors. In multi-series dual Y-axis combination chart, the tooltip of the line chart was not visible on hover. This issue is now fixed. The text alignment in the legend was not working properly ...
Release Notes: for themes 'Fusion', 'Gammel' or 'Candy'. Consolidated tooltip can now safely use '<div>' element to define tooltext. 'animateClockwise' is now working for Pie/Doughnut charts. The height of the chart canvas ... Area 2D charts, plots would not render properly when stacked with 100%, if there was a zero value. In touch devices, tooltip was not hiding on touch outside the chart. Category labels were not drawn ...
Release Notes: The 'minLabelWidthPercent' attribute has been introduced for improved control over label management. Tooltips can now be viewed in the full screen mode. The time taken to render multiple charts, especially those plotting ... Issues with rendering charts within tooltips have been fixed. Issues with finding the container DOM element, if a chart is rendered in a container without an ID, have been fixed. In the select scatter ... chart is rendered in IE9 and above browsers, has been fixed. In the zoom-scatter chart, tooltips are now rendered for the trend lines and vertical trend lines, as expected. Tooltip positioning issues, ...
Release Notes: Previously,it was getting extended upto the width of the canvas. In the zoomline chart, Traditional tooltips are now displayed when useCrossLine=0. For 2D pie charts, labelDisplay attribute now works as expected ...
Release Notes: export feature, so that IE 10 and IE 11 users can also use this feature. Fixes Extra space in the tooltip text for the last column in a column 2D chart has been removed. Large number of data sets/data ... of the canvas, if rotateValues=1. In the zoomline chart, tooltips are no longer seen for data plots that are outside the canvas area. Error encountered UIWebView on render of line charts with dashed line segments ... has been fixed. Tooltips for truncated data labels are now visible in iOS and Android devices. The displayValue property of an event argument now returns the value of the data plot, for showValue=0. ...
Release Notes: Updates in 3.9 Improvements In zoomline charts, overlapping of tooltips for data plots having very close values has been fixed. Fixes JavaScript Runtime error, caused by enabling recursive number ... or area plots are now active in combination charts with a scroll. Previously, the interactive layer of column data plots overlapped the interactive layer of line and area data plots. Tooltips for data plots ...
Release Notes: click. For pie 2D charts, the plotBorderThickness attribute is working as expected. For the zoomline chart, tooltips are now displayed when anchors are hovered over. In the zoomline dual yaxis chart, ... on the webpage when the HTML tag dir is set to rtl has now been removed. In Google Chrome, the no data to display error encountered upon the inclusion of theme in charts has been fixed. Tooltip rendering issues ... in touch devices, particularly prominent in Android devices, have been fixed. On touch devices, tooltips are shown when a data plot is tapped on Category labels in the chart data are now rendered correctly ...
Release Notes: ellipses and wrapping in ZoomLine charts. Anchors in sparkline charts now support the hover effect. New attributes for anchors to better configure their display. Support for tool-tips for the connectors ...
Release Notes: Labels now have an auto rendering mode in which they do not overlap. Additionally, x-axis labels now support ellipses and tool-tips on shortened labels. Support for line breaks and wrapping in all text ... elements including: caption, sub caption, X-axis title, Y-axis title, Labels and tooltips. In Line charts, data values can now be positioned either above or below the dataplots. Automatic positioning of data ...